63 Richardson St Wakefield, MA 01880
East Side NeighborhoodEstimated Value: $767,000 - $868,754
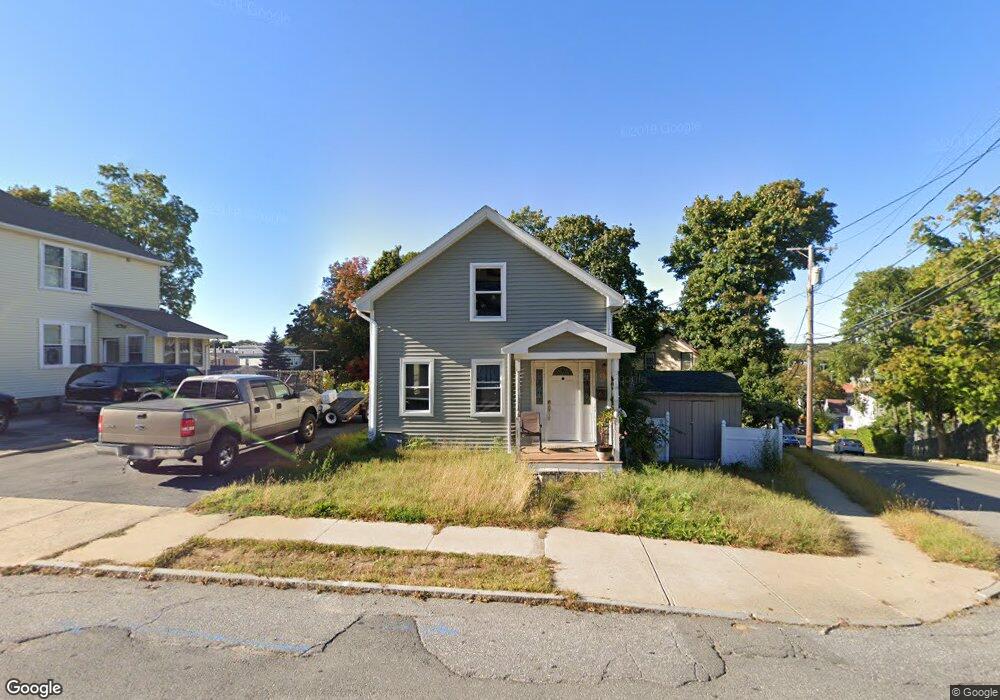
About This Home
This home is located at 63 Richardson St, Wakefield, MA 01880 and is currently estimated at $811,439, approximately $413 per square foot. 63 Richardson St is a home located in Middlesex County with nearby schools including Wakefield Memorial High School, St Joseph School, and Odyssey Day School.
Ownership History
We collect this data history from publicly available records. To have your information removed, we recommend requesting removal directly through your county’s website.
Purchase Details
Home Values in the Area
Average Home Value in this Area
Purchase History
We collect this data history from publicly available records. To have your information removed, we recommend requesting removal directly through your county’s website.
| Date | Buyer | Sale Price | Title Company |
|---|---|---|---|
| $240,000 | -- |
Mortgage History
We collect this data history from publicly available records. To have your information removed, we recommend requesting removal directly through your county’s website.
| Date | Status | Borrower | Loan Amount |
|---|---|---|---|
| Open | $50,000 | ||
| Closed | $412,500 | ||
| Closed | $232,500 | ||
| Closed | $40,000 | ||
| Closed | $250,000 |
Tax History
We collect this data history from publicly available records. To have your information removed, we recommend requesting removal directly through your county’s website.
| Year | Tax Paid | Tax Assessment Tax Assessment Total Assessment is a certain percentage of the fair market value that is determined by local assessors to be the total taxable value of land and additions on the property. | Land | Improvement |
|---|---|---|---|---|
| 2025 | $7,164 | $631,200 | $355,500 | $275,700 |
| 2024 | $7,059 | $627,500 | $353,400 | $274,100 |
| 2023 | $6,715 | $572,500 | $322,300 | $250,200 |
| 2022 | $6,425 | $521,500 | $293,500 | $228,000 |
| 2021 | $6,379 | $501,100 | $273,600 | $227,500 |
| 2020 | $5,984 | $468,600 | $255,800 | $212,800 |
| 2019 | $5,716 | $445,500 | $243,200 | $202,300 |
| 2018 | $5,321 | $410,900 | $224,300 | $186,600 |
| 2017 | $5,006 | $384,200 | $209,700 | $174,500 |
| 2016 | $5,014 | $371,700 | $198,400 | $173,300 |
| 2015 | $4,683 | $347,400 | $185,300 | $162,100 |
| 2014 | $4,270 | $334,100 | $178,200 | $155,900 |
Map
- 14 Columbia Rd
- 11 Columbia Rd Unit 8
- 4 Wakefield Ave Unit 4
- 18 Jefferson Rd Unit A
- 48 Valley St
- 61 Valley St Unit 1
- 4 Wiley Place
- 4 Pleasant St
- 294 Water St
- 18 Nahant St
- 20 Otis St
- 314 Water St Unit 6
- 5 Kathleen Dr
- 68 Preston St Unit 9D
- 14 Richardson Ave
- 50 Albion St
- 8 Everett St
- 24 Park St
- 22 Park St Unit 22A
- 22 Park St Unit B
- 59 Richardson St Unit A
- 59 Richardson St
- 59a Richardson St
- 59a Richardson St Unit Apartment 1
- 59a Richardson St
- 61 Richardson St
- 60 Richardson St
- 57A Richardson St
- 57A Richardson St Unit 1
- 2 Herbert St
- 64 Richardson St
- 64 Richardson St Unit 1
- 64 Richardson St Unit 2
- 57 Richardson St Unit B
- 57 Richardson St Unit A
- 57 Richardson St
- 4 Herbert St
- 4 Herbert St Unit 3
- 4 Herbert St Unit 2
- 58 Richardson St
Ask me questions while you tour the home.