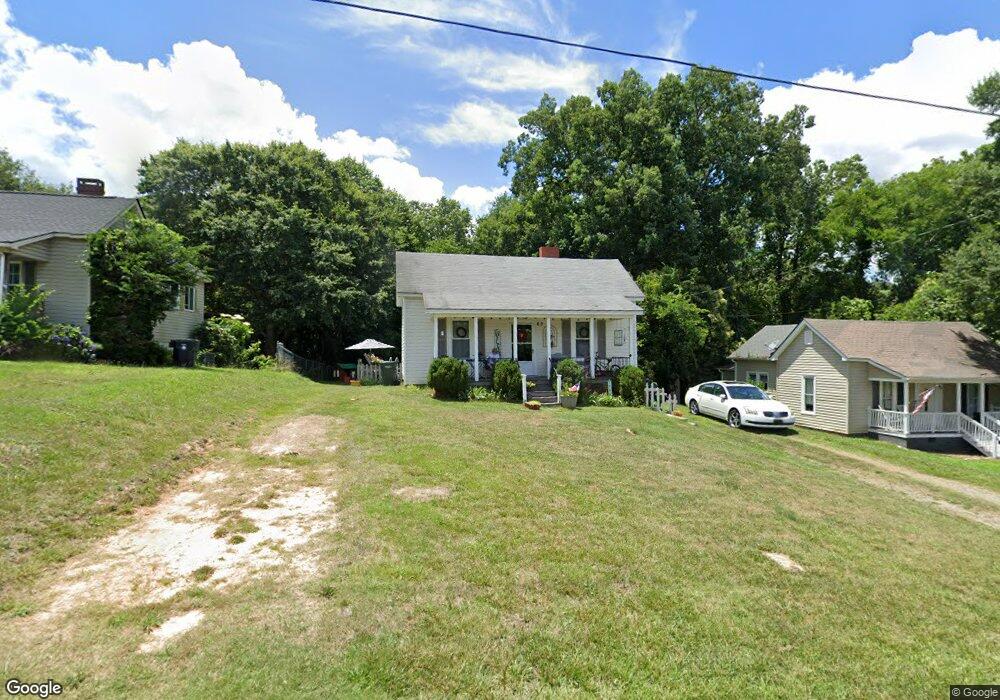
63 Robinson Dr SW Concord, NC 28027
Estimated Value: $101,000 - $178,000
1
Bed
1
Bath
846
Sq Ft
$180/Sq Ft
Est. Value
About This Home
This home is located at 63 Robinson Dr SW, Concord, NC 28027 and is currently estimated at $151,912, approximately $179 per square foot. 63 Robinson Dr SW is a home located in Cabarrus County with nearby schools including Wolf Meadow Elementary School, Roberta Road Middle School, and The Daniel Academy of Concord.
Ownership History
Date
Name
Owned For
Owner Type
Purchase Details
Closed on
Jul 9, 2013
Sold by
Johnson Jason and Johnson Rebekah L
Bought by
Johnson Jason and Johnson Thomas Harold
Current Estimated Value
Purchase Details
Closed on
Jul 3, 2013
Sold by
Rv Holdings Eleven Llc
Bought by
Johnson Jason and Johnson Rebekah L
Purchase Details
Closed on
Oct 19, 2012
Sold by
Fannie Mae
Bought by
Rv Holdings Eleven Llc
Purchase Details
Closed on
Jun 22, 2012
Sold by
Cornett Amber M
Bought by
Federal National Mortgage Association and Fannie Mae
Purchase Details
Closed on
Dec 15, 2006
Sold by
Mcdermott James M and Mcdermott Bernice M
Bought by
Cornett Amber M
Home Financials for this Owner
Home Financials are based on the most recent Mortgage that was taken out on this home.
Original Mortgage
$62,500
Interest Rate
6.29%
Mortgage Type
Purchase Money Mortgage
Purchase Details
Closed on
May 5, 2003
Sold by
Murdock David H
Bought by
Mcdermott James M and Mcdermott Bernice M
Create a Home Valuation Report for This Property
The Home Valuation Report is an in-depth analysis detailing your home's value as well as a comparison with similar homes in the area
Home Values in the Area
Average Home Value in this Area
Purchase History
| Date | Buyer | Sale Price | Title Company |
|---|---|---|---|
| Johnson Jason | -- | None Available | |
| Johnson Jason | $35,000 | None Available | |
| Rv Holdings Eleven Llc | $17,690 | Chicago Title Servicelink Di | |
| Federal National Mortgage Association | $56,903 | None Available | |
| Cornett Amber M | $62,500 | None Available | |
| Mcdermott James M | $37,500 | -- |
Source: Public Records
Mortgage History
| Date | Status | Borrower | Loan Amount |
|---|---|---|---|
| Previous Owner | Cornett Amber M | $62,500 |
Source: Public Records
Tax History Compared to Growth
Tax History
| Year | Tax Paid | Tax Assessment Tax Assessment Total Assessment is a certain percentage of the fair market value that is determined by local assessors to be the total taxable value of land and additions on the property. | Land | Improvement |
|---|---|---|---|---|
| 2025 | $1,138 | $114,210 | $57,600 | $56,610 |
| 2024 | $1,138 | $114,210 | $57,600 | $56,610 |
| 2023 | $518 | $42,420 | $18,000 | $24,420 |
| 2022 | $518 | $42,420 | $18,000 | $24,420 |
| 2021 | $518 | $42,420 | $18,000 | $24,420 |
| 2020 | $518 | $42,420 | $18,000 | $24,420 |
| 2019 | $423 | $34,640 | $12,600 | $22,040 |
| 2018 | $416 | $34,640 | $12,600 | $22,040 |
| 2017 | $409 | $34,640 | $12,600 | $22,040 |
| 2016 | -- | $37,240 | $15,000 | $22,240 |
| 2015 | $439 | $37,240 | $15,000 | $22,240 |
| 2014 | $439 | $37,240 | $15,000 | $22,240 |
Source: Public Records
Map
Nearby Homes
- 64 Robinson Dr SW
- 368 Office Dr SW
- 758 Main St SW
- 782 Chalice St SW
- 809 Fargo Dr SW
- 82 Highland Ave SW
- 84 Highland Ave SW
- 207 Highland Ave SW
- 933 Old Charlotte Rd
- 600 Sunderland Rd
- 41 Fleetwood Dr SW
- Lot #2 Faith Dr SW
- 220 Highland Ave SW
- 620 Palmer Ave SW
- 131 Swink St SW
- 7 Bost Ave SW
- 2893 Signal Ct SW
- 1015 Rockland Cir SW
- 5 Bost Ave SW
- 0000 Bost Ave SW
- 65 Robinson Dr SW
- 61 Robinson Dr SW
- 61 Robinson Dr SW Unit 26
- 62 Robinson Dr SW
- 59 Robinson Dr SW
- 60 Robinson Dr SW
- 58 Robinson Dr SW
- 66 Robinson Dr SW
- 57 Robinson Dr SW
- 67 Robinson Dr SW
- 56 Robinson Dr SW
- 68 Robinson Dr SW
- 19 Cross Ave SW
- 749 Old Charlotte Rd SW
- 18 Cross Ave SW
- 69 Robinson Dr SW
- 69 Robinson Dr SW Unit LTS 20-22 Reece Furr
- 654 Main St SW
- 71 Robinson Dr SW
- 668 Main St SW