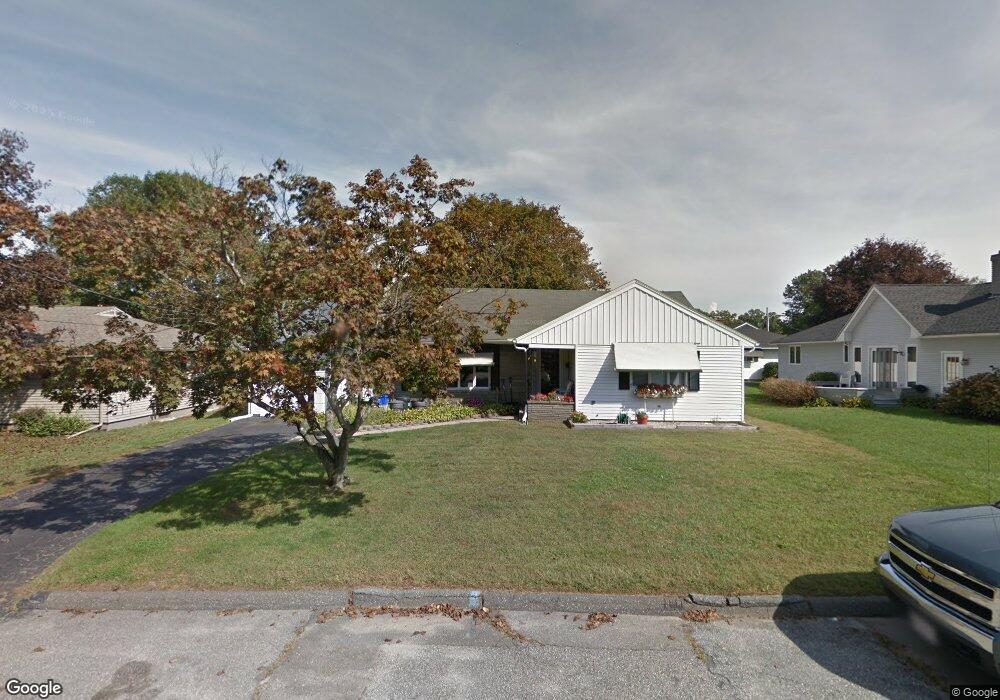
63 Rzasa Dr Chicopee, MA 01013
Chicopee Center NeighborhoodEstimated Value: $343,494 - $367,000
2
Beds
2
Baths
1,368
Sq Ft
$259/Sq Ft
Est. Value
About This Home
This home is located at 63 Rzasa Dr, Chicopee, MA 01013 and is currently estimated at $353,874, approximately $258 per square foot. 63 Rzasa Dr is a home located in Hampden County with nearby schools including Bowe Elementary School, Fairview Middle School, and Chicopee High School.
Ownership History
Date
Name
Owned For
Owner Type
Purchase Details
Closed on
Aug 26, 1999
Sold by
Krupa Stephen F and Krupa Stella N
Bought by
Felletter Christopher and Singley Sheila L
Current Estimated Value
Home Financials for this Owner
Home Financials are based on the most recent Mortgage that was taken out on this home.
Original Mortgage
$124,936
Outstanding Balance
$36,215
Interest Rate
7.53%
Mortgage Type
Purchase Money Mortgage
Estimated Equity
$317,659
Create a Home Valuation Report for This Property
The Home Valuation Report is an in-depth analysis detailing your home's value as well as a comparison with similar homes in the area
Home Values in the Area
Average Home Value in this Area
Purchase History
| Date | Buyer | Sale Price | Title Company |
|---|---|---|---|
| Felletter Christopher | $125,000 | -- |
Source: Public Records
Mortgage History
| Date | Status | Borrower | Loan Amount |
|---|---|---|---|
| Open | Felletter Christopher | $124,936 |
Source: Public Records
Tax History Compared to Growth
Tax History
| Year | Tax Paid | Tax Assessment Tax Assessment Total Assessment is a certain percentage of the fair market value that is determined by local assessors to be the total taxable value of land and additions on the property. | Land | Improvement |
|---|---|---|---|---|
| 2025 | $4,745 | $313,000 | $88,500 | $224,500 |
| 2024 | $4,499 | $304,800 | $86,800 | $218,000 |
| 2023 | $4,177 | $275,700 | $78,900 | $196,800 |
| 2022 | $3,984 | $234,500 | $68,600 | $165,900 |
| 2021 | $2,066 | $219,300 | $62,400 | $156,900 |
| 2020 | $2,083 | $200,100 | $62,400 | $137,700 |
| 2019 | $4,184 | $190,000 | $62,400 | $127,600 |
| 2018 | $2,137 | $182,000 | $59,400 | $122,600 |
| 2017 | $2,894 | $167,200 | $59,400 | $107,800 |
| 2016 | $2,782 | $164,500 | $59,400 | $105,100 |
| 2015 | $2,954 | $168,400 | $59,400 | $109,000 |
| 2014 | $1,477 | $168,400 | $59,400 | $109,000 |
Source: Public Records
Map
Nearby Homes
- 320 Fairview Ave
- 26 Leeds St
- 231 Wheatland Ave
- 30 Athol St
- 2 Marion St
- 438 Front St
- 92 Archie St
- 528 Broadway St
- 57- 59 Stearns Terrace
- Lot 1 Marion St
- 572 Springfield St
- 92 Nonotuck Ave
- 1078 Liberty St
- 74 Elmcrest Dr Unit 74
- 24 Edmund St
- 195 Mildred Ave
- 11 Calvin St
- 596-598 Newbury St
- 0 Nelson St
- 37 Kennedy St