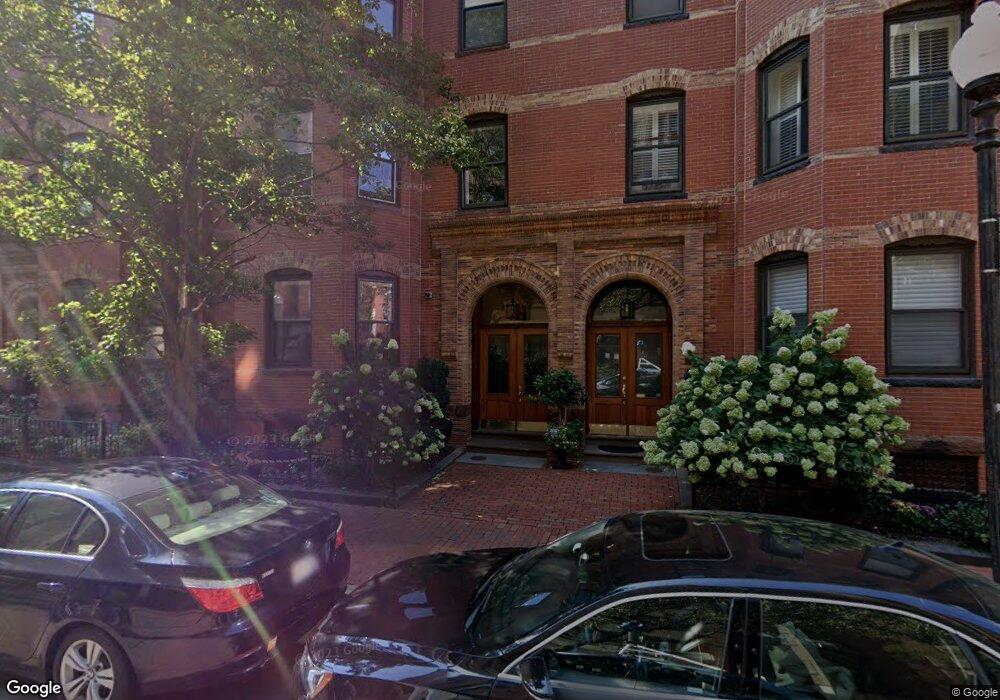
63 Saint Botolph St Unit 6 Boston, MA 02116
Back Bay NeighborhoodEstimated Value: $1,412,000 - $1,868,000
2
Beds
2
Baths
1,309
Sq Ft
$1,211/Sq Ft
Est. Value
About This Home
This home is located at 63 Saint Botolph St Unit 6, Boston, MA 02116 and is currently estimated at $1,585,582, approximately $1,211 per square foot. 63 Saint Botolph St Unit 6 is a home located in Suffolk County with nearby schools including Edward M. Kennedy Academy for Health Careers, Kingsley Montessori School, and Cathedral High School.
Ownership History
Date
Name
Owned For
Owner Type
Purchase Details
Closed on
Jul 6, 2017
Sold by
Hobson Dale and Perez Gabriela
Bought by
Singh Adhijeet and Rao Maithri
Current Estimated Value
Home Financials for this Owner
Home Financials are based on the most recent Mortgage that was taken out on this home.
Original Mortgage
$950,000
Outstanding Balance
$765,050
Interest Rate
3%
Mortgage Type
Adjustable Rate Mortgage/ARM
Estimated Equity
$820,532
Purchase Details
Closed on
Jul 30, 2009
Sold by
Das Sai K and Murthy Kedar D
Bought by
Hobson Dale and Perez Gabriela
Home Financials for this Owner
Home Financials are based on the most recent Mortgage that was taken out on this home.
Original Mortgage
$523,750
Interest Rate
5.43%
Mortgage Type
Purchase Money Mortgage
Create a Home Valuation Report for This Property
The Home Valuation Report is an in-depth analysis detailing your home's value as well as a comparison with similar homes in the area
Home Values in the Area
Average Home Value in this Area
Purchase History
| Date | Buyer | Sale Price | Title Company |
|---|---|---|---|
| Singh Adhijeet | $1,400,000 | -- | |
| Hobson Dale | $879,000 | -- | |
| Hobson Dale | $879,000 | -- |
Source: Public Records
Mortgage History
| Date | Status | Borrower | Loan Amount |
|---|---|---|---|
| Open | Singh Adhijeet | $950,000 | |
| Closed | Hobson Dale | $950,000 | |
| Previous Owner | Hobson Dale | $523,750 | |
| Previous Owner | Hobson Dale | $179,450 |
Source: Public Records
Tax History Compared to Growth
Tax History
| Year | Tax Paid | Tax Assessment Tax Assessment Total Assessment is a certain percentage of the fair market value that is determined by local assessors to be the total taxable value of land and additions on the property. | Land | Improvement |
|---|---|---|---|---|
| 2025 | $16,877 | $1,457,400 | $0 | $1,457,400 |
| 2024 | $15,279 | $1,401,700 | $0 | $1,401,700 |
| 2023 | $14,609 | $1,360,200 | $0 | $1,360,200 |
| 2022 | $14,094 | $1,295,400 | $0 | $1,295,400 |
| 2021 | $13,822 | $1,295,400 | $0 | $1,295,400 |
| 2020 | $13,158 | $1,246,000 | $0 | $1,246,000 |
| 2019 | $12,751 | $1,209,800 | $0 | $1,209,800 |
| 2018 | $13,820 | $1,318,700 | $0 | $1,318,700 |
| 2017 | $13,179 | $1,244,500 | $0 | $1,244,500 |
| 2016 | $13,163 | $1,196,600 | $0 | $1,196,600 |
| 2015 | $12,218 | $1,008,900 | $0 | $1,008,900 |
| 2014 | $11,648 | $925,900 | $0 | $925,900 |
Source: Public Records
Map
Nearby Homes
- 8 Garrison St Unit 706
- 15 Garrison St Unit 7
- 9-17 Harcourt St Unit 503
- 94 Saint Botolph St Unit 1
- 257 W Newton St
- 231 W Newton St Unit 3
- 100 Belvidere St Unit 7A
- 100 Belvidere St Unit 4G
- 234 W Newton St Unit 1
- 16 Holyoke St Unit 2
- 230-232 W Newton St Unit B
- 1 Huntington Ave Unit 707
- 1 Huntington Ave Unit 403
- 1 Huntington Ave Unit 904
- 1 Huntington Ave Unit 1101
- 1 Huntington Ave Unit 603
- 1 Huntington Ave Unit PH1702
- 1 Huntington Ave Unit 401
- 1 Huntington Ave Unit 903
- 131 Saint Botolph St Unit 1
- 63 Saint Botolph St
- 63 Saint Botolph St Unit 5
- 63 Saint Botolph St Unit 4
- 63 Saint Botolph St Unit 3
- 63 Saint Botolph St Unit 2
- 63 Saint Botolph St Unit 1
- 63 Saint Botolph St
- 63 Saint Botolph St Unit PH
- 63 Saint Botolph St Unit PH
- 65 Saint Botolph St Unit 4
- 65 Saint Botolph St Unit 3
- 65 Saint Botolph St Unit 2
- 65 Saint Botolph St Unit 1
- 65 Saint Botolph St Unit 41
- 65 Saint Botolph St Unit 8
- 65 Saint Botolph St Unit 518
- 65 Saint Botolph St Unit 524
- 65 Saint Botolph St Unit 515
- 65 Saint Botolph St Unit 519
- 65 Saint Botolph St Unit 6