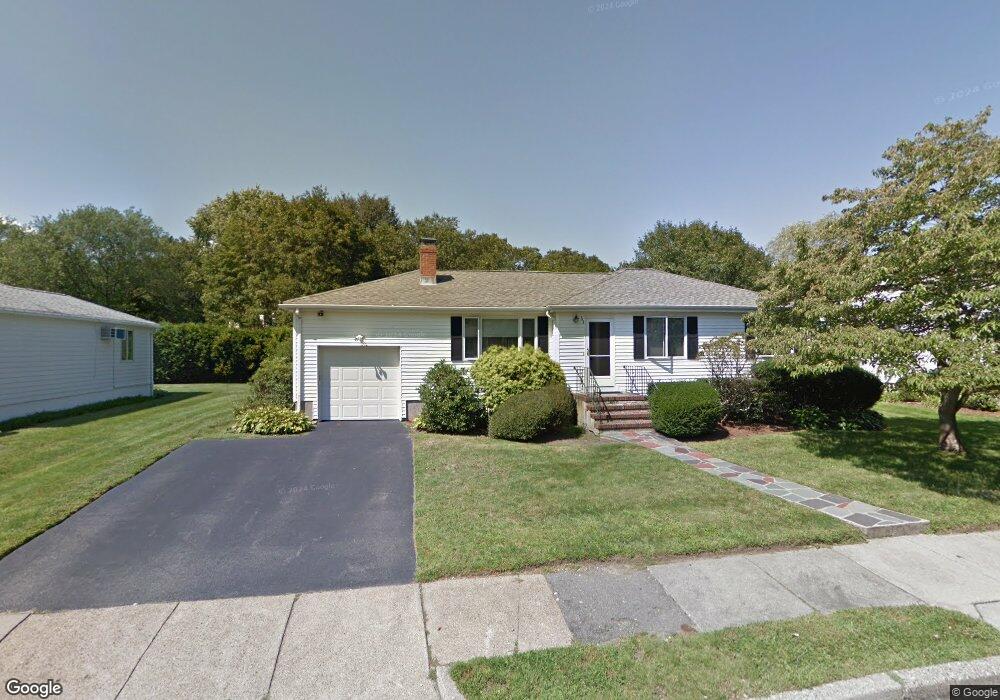
63 Selwyn Rd Newton Highlands, MA 02461
Newton Highlands NeighborhoodEstimated Value: $1,202,000 - $1,461,000
3
Beds
3
Baths
1,807
Sq Ft
$758/Sq Ft
Est. Value
About This Home
This home is located at 63 Selwyn Rd, Newton Highlands, MA 02461 and is currently estimated at $1,369,407, approximately $757 per square foot. 63 Selwyn Rd is a home located in Middlesex County with nearby schools including Countryside Elementary School, Charles E Brown Middle School, and Newton South High School.
Ownership History
Date
Name
Owned For
Owner Type
Purchase Details
Closed on
Aug 14, 1992
Sold by
Heymann Melvin I
Bought by
Lane Scott M and Ungar Sharon F
Current Estimated Value
Home Financials for this Owner
Home Financials are based on the most recent Mortgage that was taken out on this home.
Original Mortgage
$155,000
Interest Rate
8.26%
Mortgage Type
Purchase Money Mortgage
Create a Home Valuation Report for This Property
The Home Valuation Report is an in-depth analysis detailing your home's value as well as a comparison with similar homes in the area
Home Values in the Area
Average Home Value in this Area
Purchase History
| Date | Buyer | Sale Price | Title Company |
|---|---|---|---|
| Lane Scott M | $259,000 | -- |
Source: Public Records
Mortgage History
| Date | Status | Borrower | Loan Amount |
|---|---|---|---|
| Open | Lane Scott M | $100,000 | |
| Closed | Lane Scott M | $155,000 |
Source: Public Records
Tax History Compared to Growth
Tax History
| Year | Tax Paid | Tax Assessment Tax Assessment Total Assessment is a certain percentage of the fair market value that is determined by local assessors to be the total taxable value of land and additions on the property. | Land | Improvement |
|---|---|---|---|---|
| 2025 | $10,598 | $1,081,400 | $943,300 | $138,100 |
| 2024 | $10,247 | $1,049,900 | $915,800 | $134,100 |
| 2023 | $9,694 | $952,300 | $702,600 | $249,700 |
| 2022 | $9,277 | $881,800 | $650,600 | $231,200 |
| 2021 | $8,951 | $831,900 | $613,800 | $218,100 |
| 2020 | $8,685 | $831,900 | $613,800 | $218,100 |
| 2019 | $8,440 | $807,700 | $595,900 | $211,800 |
| 2018 | $8,066 | $745,500 | $540,800 | $204,700 |
| 2017 | $7,821 | $703,300 | $510,200 | $193,100 |
| 2016 | $7,480 | $657,300 | $476,800 | $180,500 |
| 2015 | $7,132 | $614,300 | $445,600 | $168,700 |
Source: Public Records
Map
Nearby Homes
- 250 Woodcliff Rd
- 19 Selwyn Rd
- 36 Cannon St
- 125 Oakdale Rd
- 1308 Walnut St
- 628 Boylston St
- 671 Boylston St
- 21 Philbrick Rd
- 45 Brandeis Rd
- 1292 Walnut St
- 35 Haynes Rd
- 625 Boylston St
- 42 Sunhill Ln
- 15 Buff Cir
- 116 Upland Ave
- 1629 Centre St
- 1623-1625 Centre St
- 5 Halcyon Rd
- 1597 Centre St Unit 1597
- 1597 Centre St