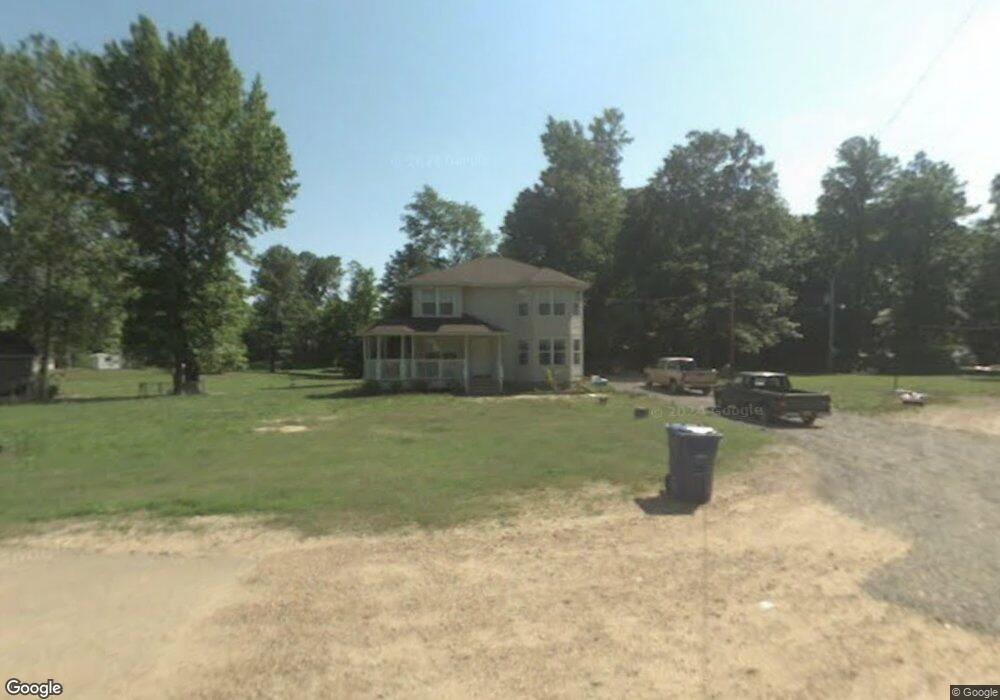
63 Sfc 337 Forrest City, AR 72335
Estimated Value: $136,423 - $189,000
--
Bed
3
Baths
1,750
Sq Ft
$91/Sq Ft
Est. Value
About This Home
This home is located at 63 Sfc 337, Forrest City, AR 72335 and is currently estimated at $159,356, approximately $91 per square foot. 63 Sfc 337 is a home located in St. Francis County with nearby schools including Central Elementary School, Stewart Elementary School, and Forrest City Junior High School.
Ownership History
Date
Name
Owned For
Owner Type
Purchase Details
Closed on
Jul 25, 2024
Sold by
Phillips Amber
Bought by
Phillips Chaddrick
Current Estimated Value
Purchase Details
Closed on
Aug 31, 2018
Sold by
Hickman Doris Jean Mosley and Hickman Jesse
Bought by
Phillips Chad and Phillips Amber
Home Financials for this Owner
Home Financials are based on the most recent Mortgage that was taken out on this home.
Original Mortgage
$113,898
Interest Rate
4.37%
Mortgage Type
FHA
Purchase Details
Closed on
Dec 13, 2011
Bought by
Mosley Doris Jean
Purchase Details
Closed on
Oct 23, 2009
Sold by
Stultz Danny and Stultz Kim
Bought by
Walter Mortgage Co
Purchase Details
Closed on
Sep 26, 2006
Sold by
Mcgill Billy
Bought by
Stultz Danny
Purchase Details
Closed on
Jul 19, 2006
Sold by
Mcgill Billy J and Mcgill Ruth
Bought by
Stultz Danny
Purchase Details
Closed on
Sep 1, 1983
Bought by
James Terry
Purchase Details
Closed on
Sep 1, 1971
Bought by
Terry
Create a Home Valuation Report for This Property
The Home Valuation Report is an in-depth analysis detailing your home's value as well as a comparison with similar homes in the area
Home Values in the Area
Average Home Value in this Area
Purchase History
| Date | Buyer | Sale Price | Title Company |
|---|---|---|---|
| Phillips Chaddrick | -- | None Listed On Document | |
| Phillips Chad | $116,000 | Forrest City Abstract | |
| Mosley Doris Jean | $12,000 | -- | |
| Walter Mortgage Co | $141,997 | None Available | |
| Stultz Danny | $1,000 | -- | |
| Stultz Danny | $400 | None Available | |
| James Terry | -- | -- | |
| Terry | $4,900 | -- |
Source: Public Records
Mortgage History
| Date | Status | Borrower | Loan Amount |
|---|---|---|---|
| Previous Owner | Phillips Chad | $113,898 |
Source: Public Records
Tax History Compared to Growth
Tax History
| Year | Tax Paid | Tax Assessment Tax Assessment Total Assessment is a certain percentage of the fair market value that is determined by local assessors to be the total taxable value of land and additions on the property. | Land | Improvement |
|---|---|---|---|---|
| 2024 | $875 | $22,380 | $500 | $21,880 |
| 2023 | $391 | $22,380 | $500 | $21,880 |
| 2022 | $404 | $22,380 | $500 | $21,880 |
| 2021 | $366 | $19,110 | $500 | $18,610 |
| 2020 | $366 | $19,110 | $500 | $18,610 |
| 2019 | $386 | $19,110 | $500 | $18,610 |
| 2018 | $411 | $19,110 | $500 | $18,610 |
| 2017 | $761 | $19,110 | $500 | $18,610 |
| 2016 | $737 | $18,520 | $500 | $18,020 |
| 2015 | $737 | $18,520 | $500 | $18,020 |
| 2014 | $737 | $18,520 | $500 | $18,020 |
Source: Public Records
Map
Nearby Homes
- 481 Sfc 333
- 30+\- Acres Sfc 328
- 802 Sfc 328
- 192 Sfc 322
- 0 Good Hope Rd
- 533 Sfc 311
- 0 Sfc 355
- 211 Woods Rd
- 8697 Highway 284
- 0 N Washington St
- 4.59 Acres N Washington St
- 2073 Arkansas 306
- 361 Yorktown Dr
- 917 Calvert Cove
- 220 Lexington Dr
- 308 Trenton Rd
- 296 Old Military Rd E
- 347 Old Military Rd E
- 1255 Chestnut St
- 423 Laughrun Dr