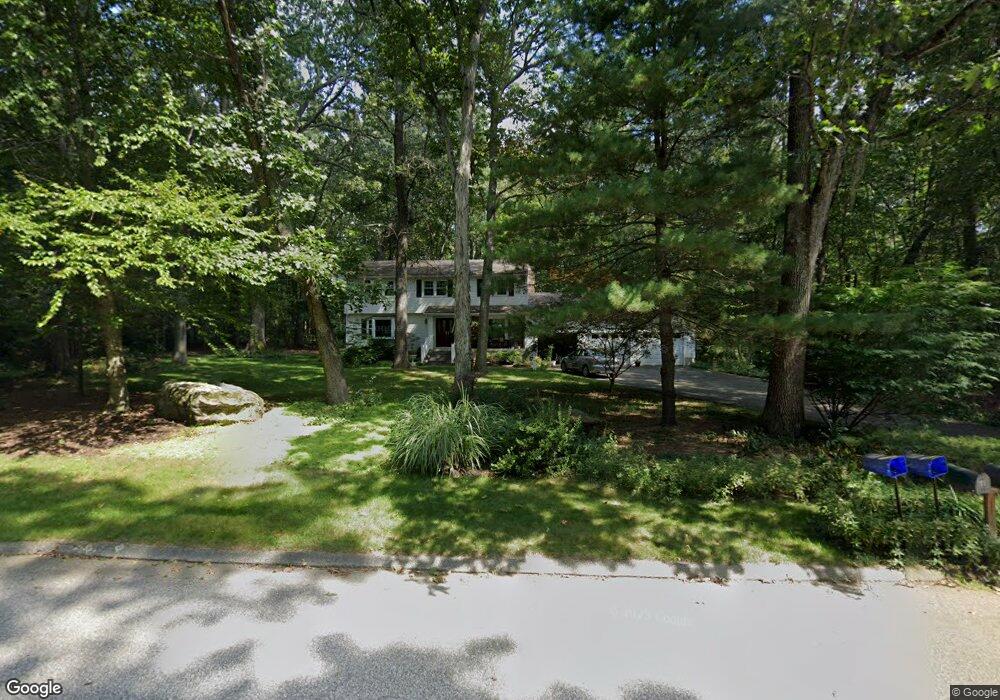
63 Shanda Ln Tolland, CT 06084
Estimated Value: $440,370 - $498,000
4
Beds
3
Baths
2,058
Sq Ft
$226/Sq Ft
Est. Value
About This Home
This home is located at 63 Shanda Ln, Tolland, CT 06084 and is currently estimated at $464,593, approximately $225 per square foot. 63 Shanda Ln is a home located in Tolland County with nearby schools including Tolland High School.
Ownership History
Date
Name
Owned For
Owner Type
Purchase Details
Closed on
Jan 24, 1994
Sold by
Davidson Edward R and Davidson Gae
Bought by
Hoke James and Hoke Mary Ann
Current Estimated Value
Home Financials for this Owner
Home Financials are based on the most recent Mortgage that was taken out on this home.
Original Mortgage
$160,200
Interest Rate
7.08%
Mortgage Type
Unknown
Create a Home Valuation Report for This Property
The Home Valuation Report is an in-depth analysis detailing your home's value as well as a comparison with similar homes in the area
Home Values in the Area
Average Home Value in this Area
Purchase History
We collect this data history from publicly available records. To have your information removed, we recommend requesting removal directly through your county’s website.
| Date | Buyer | Sale Price | Title Company |
|---|---|---|---|
| Hoke James | $178,000 | -- | |
| Hoke James | $178,000 | -- |
Source: Public Records
Mortgage History
We collect this data history from publicly available records. To have your information removed, we recommend requesting removal directly through your county’s website.
| Date | Status | Borrower | Loan Amount |
|---|---|---|---|
| Closed | Hoke James | $147,000 | |
| Closed | Hoke James | $140,456 | |
| Closed | Hoke James | $142,300 | |
| Closed | Hoke James | $160,200 |
Source: Public Records
Tax History
| Year | Tax Paid | Tax Assessment Tax Assessment Total Assessment is a certain percentage of the fair market value that is determined by local assessors to be the total taxable value of land and additions on the property. | Land | Improvement |
|---|---|---|---|---|
| 2025 | $7,504 | $276,000 | $70,800 | $205,200 |
| 2024 | $7,018 | $185,800 | $67,400 | $118,400 |
| 2023 | $6,936 | $185,800 | $67,400 | $118,400 |
| 2022 | $6,797 | $185,800 | $67,400 | $118,400 |
| 2021 | $6,895 | $185,800 | $67,400 | $118,400 |
| 2020 | $6,698 | $185,800 | $67,400 | $118,400 |
| 2019 | $6,979 | $193,600 | $69,500 | $124,100 |
| 2018 | $6,776 | $193,600 | $69,500 | $124,100 |
| 2017 | $6,619 | $193,600 | $69,500 | $124,100 |
| 2016 | $6,619 | $193,600 | $69,500 | $124,100 |
| 2015 | $6,458 | $193,600 | $69,500 | $124,100 |
| 2014 | $6,250 | $201,300 | $77,200 | $124,100 |
Source: Public Records
Map
Nearby Homes
- 200 Baxter St
- 312 Merrow Rd
- 317 Merrow Rd
- 248 Merrow Rd
- 24 Sherry Cir
- 106 David Dr
- 166 Anthony Rd
- 198 N Farms Rd
- 151 Kate Ln
- 9 Deer Hill Ln
- 745 Merrow Rd Unit 192
- 745 Merrow Rd Unit 136
- 14 Joshua Ln
- 1728 Stafford Rd
- 0 Merrow Rd Unit 24167692
- 0 Merrow Rd Unit 24141193
- 35 Birchwood Dr
- 23 Baxter Rd
- 55 Mary Belle Dr
- 230 Kate Ln
Your Personal Tour Guide
Ask me questions while you tour the home.