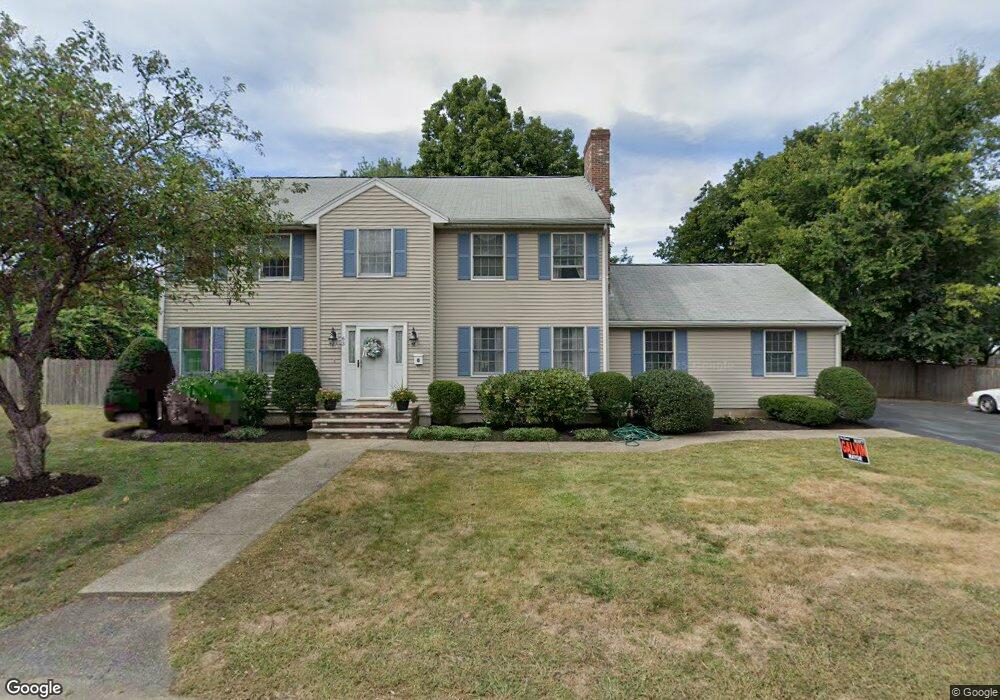
63 Sheridan St Woburn, MA 01801
Cummingsville NeighborhoodEstimated Value: $1,016,000 - $1,182,000
4
Beds
3
Baths
2,752
Sq Ft
$407/Sq Ft
Est. Value
About This Home
This home is located at 63 Sheridan St, Woburn, MA 01801 and is currently estimated at $1,119,769, approximately $406 per square foot. 63 Sheridan St is a home located in Middlesex County with nearby schools including Hurld Elementary School, Daniel L. Joyce Middle School, and Woburn High School.
Ownership History
Date
Name
Owned For
Owner Type
Purchase Details
Closed on
Jan 18, 2013
Sold by
Dillon Jeffrey P
Bought by
Dillon
Current Estimated Value
Purchase Details
Closed on
May 29, 1991
Sold by
Latham Bertram W Est
Bought by
Dillon Jeffrey P and Dillon Mary E
Create a Home Valuation Report for This Property
The Home Valuation Report is an in-depth analysis detailing your home's value as well as a comparison with similar homes in the area
Home Values in the Area
Average Home Value in this Area
Purchase History
| Date | Buyer | Sale Price | Title Company |
|---|---|---|---|
| Dillon | -- | -- | |
| J & M Dillon Ret | -- | -- | |
| Dillon Jeffrey P | $80,000 | -- | |
| Dillon Jeffrey P | $80,000 | -- |
Source: Public Records
Mortgage History
| Date | Status | Borrower | Loan Amount |
|---|---|---|---|
| Previous Owner | Dillon Jeffrey P | $25,000 | |
| Previous Owner | Dillon Jeffrey P | $100,000 |
Source: Public Records
Tax History Compared to Growth
Tax History
| Year | Tax Paid | Tax Assessment Tax Assessment Total Assessment is a certain percentage of the fair market value that is determined by local assessors to be the total taxable value of land and additions on the property. | Land | Improvement |
|---|---|---|---|---|
| 2025 | $7,910 | $926,200 | $336,600 | $589,600 |
| 2024 | $7,105 | $881,500 | $320,600 | $560,900 |
| 2023 | $7,121 | $818,500 | $291,500 | $527,000 |
| 2022 | $6,986 | $748,000 | $253,700 | $494,300 |
| 2021 | $6,715 | $719,700 | $241,700 | $478,000 |
| 2020 | $6,428 | $689,700 | $241,700 | $448,000 |
| 2019 | $6,237 | $656,500 | $230,300 | $426,200 |
| 2018 | $6,099 | $616,700 | $211,400 | $405,300 |
| 2017 | $5,636 | $567,000 | $201,500 | $365,500 |
| 2016 | $5,396 | $536,900 | $188,400 | $348,500 |
| 2015 | $5,220 | $513,300 | $176,200 | $337,100 |
| 2014 | $5,033 | $482,100 | $176,200 | $305,900 |
Source: Public Records
Map
Nearby Homes
- 12 Cassidy Dr
- 7 Locust St
- 4 Ardmore Ave
- 17 Wright St
- 29 Overlook Ave
- 68 Hammond Place Unit 68
- 36 Cambridge Rd Unit 40
- 19 Hammond Place Unit 19
- 18 Hamilton Rd
- 26 Flagg St
- 37 1/2 Chestnut St
- 462 Place Ln
- 166 Place Ln Unit 166
- 168 Place Ln
- 18 Beacon St Unit 18
- 21 Franklin St
- 52 Pleasant St
- 31 Arlington Rd Unit 1-6
- 602 Main St Unit 1
- 11 Hovey St