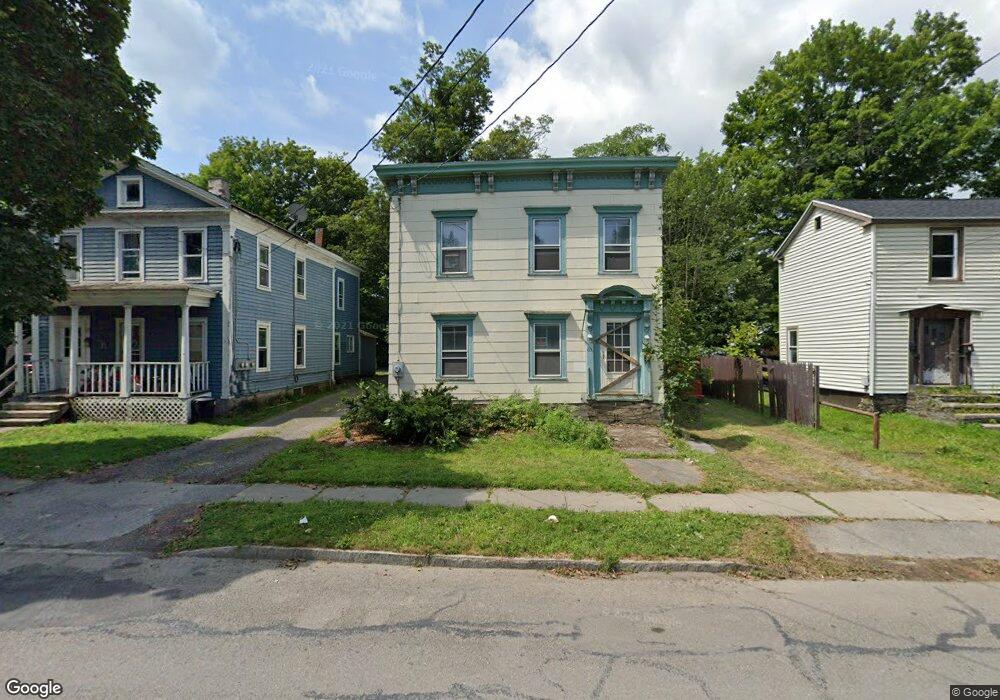
63 Silver St Norwich, NY 13815
Estimated Value: $88,000 - $127,000
5
Beds
2
Baths
2,030
Sq Ft
$55/Sq Ft
Est. Value
About This Home
This home is located at 63 Silver St, Norwich, NY 13815 and is currently estimated at $111,284, approximately $54 per square foot. 63 Silver St is a home located in Chenango County with nearby schools including Stanford J. Gibson Primary School, Perry Browne Intermediate School, and Norwich Middle School.
Ownership History
Date
Name
Owned For
Owner Type
Purchase Details
Closed on
Aug 3, 2022
Sold by
Brightman Trucking Llc
Bought by
Norwich Hm Movement Llc
Current Estimated Value
Purchase Details
Closed on
Jul 15, 2021
Sold by
Norwich City Of
Bought by
Ryan Martha I
Purchase Details
Closed on
Jul 5, 2011
Sold by
Green Charles R
Bought by
Delfino Mark T
Home Financials for this Owner
Home Financials are based on the most recent Mortgage that was taken out on this home.
Original Mortgage
$74,891
Interest Rate
4.62%
Mortgage Type
Purchase Money Mortgage
Purchase Details
Closed on
Apr 29, 1996
Create a Home Valuation Report for This Property
The Home Valuation Report is an in-depth analysis detailing your home's value as well as a comparison with similar homes in the area
Home Values in the Area
Average Home Value in this Area
Purchase History
| Date | Buyer | Sale Price | Title Company |
|---|---|---|---|
| Norwich Hm Movement Llc | $32,000 | None Available | |
| Ryan Martha I | -- | None Available | |
| Norwich City Of | $2,728 | None Available | |
| Delfino Mark T | $76,850 | Mark T Delfino | |
| -- | $29,000 | -- |
Source: Public Records
Mortgage History
| Date | Status | Borrower | Loan Amount |
|---|---|---|---|
| Previous Owner | Delfino Mark T | $74,891 |
Source: Public Records
Tax History
| Year | Tax Paid | Tax Assessment Tax Assessment Total Assessment is a certain percentage of the fair market value that is determined by local assessors to be the total taxable value of land and additions on the property. | Land | Improvement |
|---|---|---|---|---|
| 2025 | $3,712 | $46,300 | $5,700 | $40,600 |
| 2024 | $3,712 | $46,300 | $5,700 | $40,600 |
| 2023 | $3,550 | $46,300 | $5,700 | $40,600 |
| 2022 | $3,557 | $46,300 | $5,700 | $40,600 |
| 2021 | $3,612 | $46,300 | $5,700 | $40,600 |
| 2020 | $3,516 | $46,300 | $5,700 | $40,600 |
| 2019 | $3,790 | $46,300 | $5,700 | $40,600 |
| 2018 | $3,790 | $46,300 | $5,700 | $40,600 |
| 2017 | $914 | $46,300 | $5,700 | $40,600 |
| 2016 | $928 | $46,300 | $5,700 | $40,600 |
| 2015 | -- | $46,300 | $5,700 | $40,600 |
| 2014 | -- | $46,300 | $5,700 | $40,600 |
Source: Public Records
Map
Nearby Homes
Your Personal Tour Guide
Ask me questions while you tour the home.