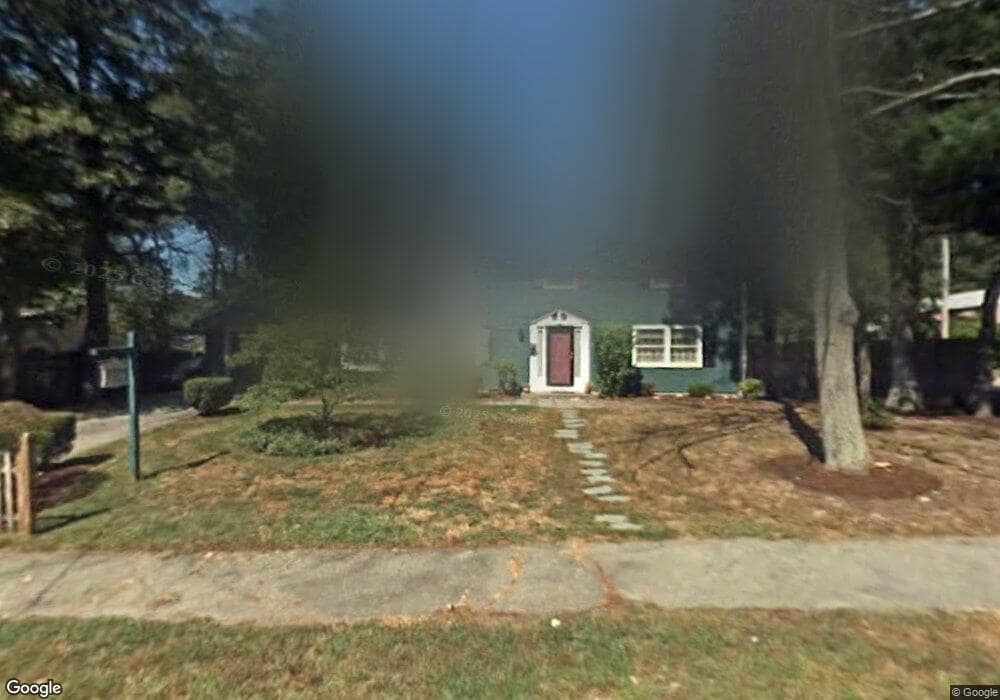
63 Sinclair Rd Brockton, MA 02302
Estimated Value: $529,000 - $627,000
4
Beds
3
Baths
2,240
Sq Ft
$265/Sq Ft
Est. Value
About This Home
This home is located at 63 Sinclair Rd, Brockton, MA 02302 and is currently estimated at $593,926, approximately $265 per square foot. 63 Sinclair Rd is a home located in Plymouth County with nearby schools including Gilmore Elementary School, Davis K-8 School, and John F. Kennedy Elementary School.
Ownership History
Date
Name
Owned For
Owner Type
Purchase Details
Closed on
Jan 31, 2023
Sold by
Cusick Karen A
Bought by
K A Considine Cusick Ft
Current Estimated Value
Purchase Details
Closed on
Jul 22, 2010
Sold by
Cusick Richard O and Cusick Karen A
Bought by
Cusick Karen A
Create a Home Valuation Report for This Property
The Home Valuation Report is an in-depth analysis detailing your home's value as well as a comparison with similar homes in the area
Purchase History
| Date | Buyer | Sale Price | Title Company |
|---|---|---|---|
| K A Considine Cusick Ft | -- | None Available | |
| Cusick Karen A | -- | -- |
Source: Public Records
Tax History
| Year | Tax Paid | Tax Assessment Tax Assessment Total Assessment is a certain percentage of the fair market value that is determined by local assessors to be the total taxable value of land and additions on the property. | Land | Improvement |
|---|---|---|---|---|
| 2025 | $6,156 | $508,300 | $159,600 | $348,700 |
| 2024 | $6,034 | $502,000 | $159,600 | $342,400 |
| 2023 | $6,212 | $478,600 | $109,800 | $368,800 |
| 2022 | $5,904 | $422,600 | $99,800 | $322,800 |
| 2021 | $5,690 | $392,400 | $92,500 | $299,900 |
| 2020 | $4,993 | $329,600 | $81,200 | $248,400 |
| 2019 | $5,363 | $345,100 | $77,500 | $267,600 |
| 2018 | $4,405 | $299,700 | $77,500 | $222,200 |
| 2017 | $4,405 | $273,600 | $77,500 | $196,100 |
| 2016 | $4,239 | $244,200 | $73,900 | $170,300 |
| 2015 | $4,000 | $220,400 | $73,900 | $146,500 |
| 2014 | $3,851 | $212,400 | $73,900 | $138,500 |
Source: Public Records
Map
Nearby Homes
- 578 Plain St
- 23 Dondi Rd
- 118 Deanna Rd
- 15 Wachusetts Rd
- 12 Paulin Ave
- 1 Thomas Cir
- 549 Summer St
- 463 Pleasant St
- 31 Friendship Dr
- 111 Riverview St
- 55 Marjan Dr
- 10 Colleen Way
- 16 Liberty St
- 9 Longworth Ave Unit 135
- 9 Longworth Ave Unit 113
- 15 Longworth Ave Unit 226
- 25 Longworth Ave Unit 4
- 16 Jason Way
- 35 Longworth Ave Unit 25
- 41 Riverview St
Your Personal Tour Guide
Ask me questions while you tour the home.