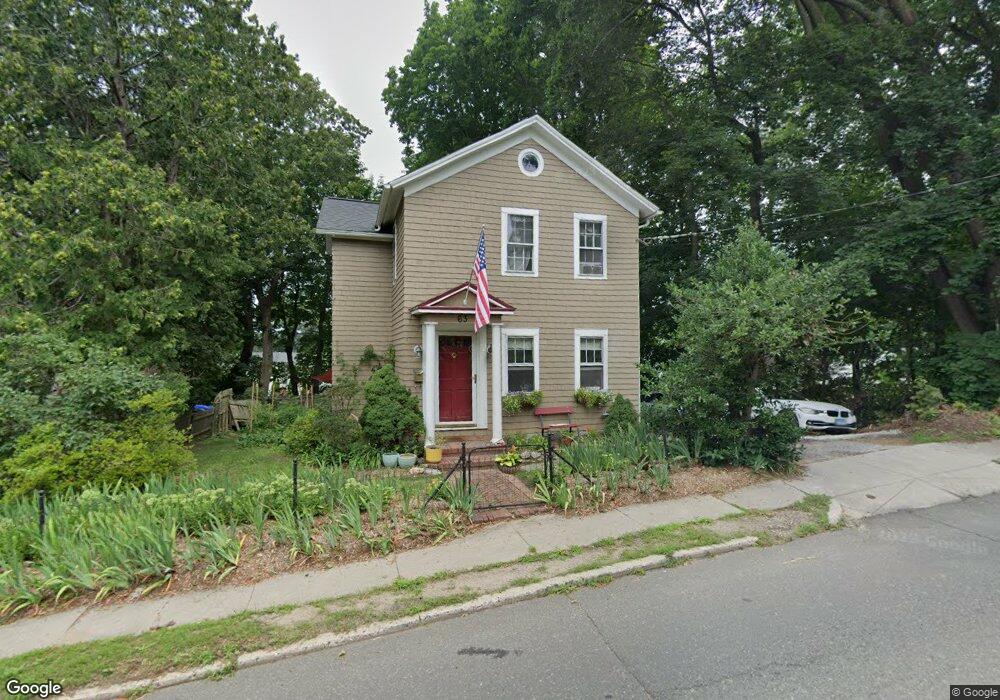
63 South St Bethel, CT 06801
Estimated Value: $265,000 - $439,191
2
Beds
1
Bath
1,172
Sq Ft
$309/Sq Ft
Est. Value
About This Home
This home is located at 63 South St, Bethel, CT 06801 and is currently estimated at $362,298, approximately $309 per square foot. 63 South St is a home located in Fairfield County with nearby schools including R.M.T. Johnson School, Bethel Middle School, and Bethel High School.
Ownership History
Date
Name
Owned For
Owner Type
Purchase Details
Closed on
Jul 19, 2000
Sold by
Schowalter Lynn M
Bought by
Gorman Colin E and Gorman Jennifer L
Current Estimated Value
Purchase Details
Closed on
Aug 18, 1995
Sold by
Guzek Karen
Bought by
Schowalter Lynn
Purchase Details
Closed on
Jan 23, 1992
Sold by
Hintelman Philip F
Bought by
Besanceney Karen G
Create a Home Valuation Report for This Property
The Home Valuation Report is an in-depth analysis detailing your home's value as well as a comparison with similar homes in the area
Home Values in the Area
Average Home Value in this Area
Purchase History
| Date | Buyer | Sale Price | Title Company |
|---|---|---|---|
| Gorman Colin E | $155,000 | -- | |
| Schowalter Lynn | $130,000 | -- | |
| Besanceney Karen G | $103,000 | -- |
Source: Public Records
Mortgage History
| Date | Status | Borrower | Loan Amount |
|---|---|---|---|
| Open | Besanceney Karen G | $117,321 | |
| Closed | Besanceney Karen G | $125,500 | |
| Closed | Besanceney Karen G | $155,000 |
Source: Public Records
Tax History Compared to Growth
Tax History
| Year | Tax Paid | Tax Assessment Tax Assessment Total Assessment is a certain percentage of the fair market value that is determined by local assessors to be the total taxable value of land and additions on the property. | Land | Improvement |
|---|---|---|---|---|
| 2025 | $6,584 | $216,510 | $92,260 | $124,250 |
| 2024 | $6,316 | $216,510 | $92,260 | $124,250 |
| 2023 | $6,155 | $216,510 | $92,260 | $124,250 |
| 2022 | $6,075 | $175,630 | $92,260 | $83,370 |
| 2021 | $6,017 | $175,630 | $92,260 | $83,370 |
| 2020 | $5,926 | $175,630 | $92,260 | $83,370 |
| 2019 | $5,868 | $175,630 | $92,260 | $83,370 |
| 2018 | $5,773 | $175,630 | $92,260 | $83,370 |
| 2017 | $5,047 | $153,510 | $69,020 | $84,490 |
| 2016 | $4,938 | $153,510 | $69,020 | $84,490 |
| 2015 | $4,940 | $153,510 | $69,020 | $84,490 |
| 2014 | $4,929 | $153,510 | $69,020 | $84,490 |
Source: Public Records
Map
Nearby Homes
- 48 & 50 Nashville Rd
- 2 Chestnut St
- 66 Nashville Rd Unit L
- 4 Bailey Blvd Unit 4
- 95 Chestnut St Unit D
- 51 Kingswood Dr
- 21 Oven Rock Rd
- 3 Idlewood Unit 3
- 12 Eagle Rock Hill Unit 12
- 89 Knollwood Dr
- 2 Judd Ave
- 12 Canaan Dr
- 17 Briar Ridge Dr Unit 17
- 134 Nashville Rd
- 80 Tucker St Unit 80
- 27 Long Meadow Ln
- 121 Great Hill Dr Unit 121
- 37 Whittlesey Dr
- 30 Mountain Rd
- 27 Crows Nest Ln Unit 8F
- 65 South St
- 65 South St Unit 1
- 61 South St
- 174 Greenwood Ave
- 14 Depot Place Unit 3
- 14 Depot Place Unit A
- 14 Depot Place Unit B
- 14 Depot Place Unit 1
- 14 Depot Place Unit 8
- 14 Depot Place Unit 6
- 14 Depot Place Unit 9
- 14 Depot Place Unit 2nd fl
- 14 Depot Place
- 14 Depot Place Unit 7
- 12 Depot Place Unit 3rd Floor
- 72 South St
- 178 Greenwood Ave
- 162 Greenwood Ave Unit B
- 162 Greenwood Ave Unit A
- 162 Greenwood Ave