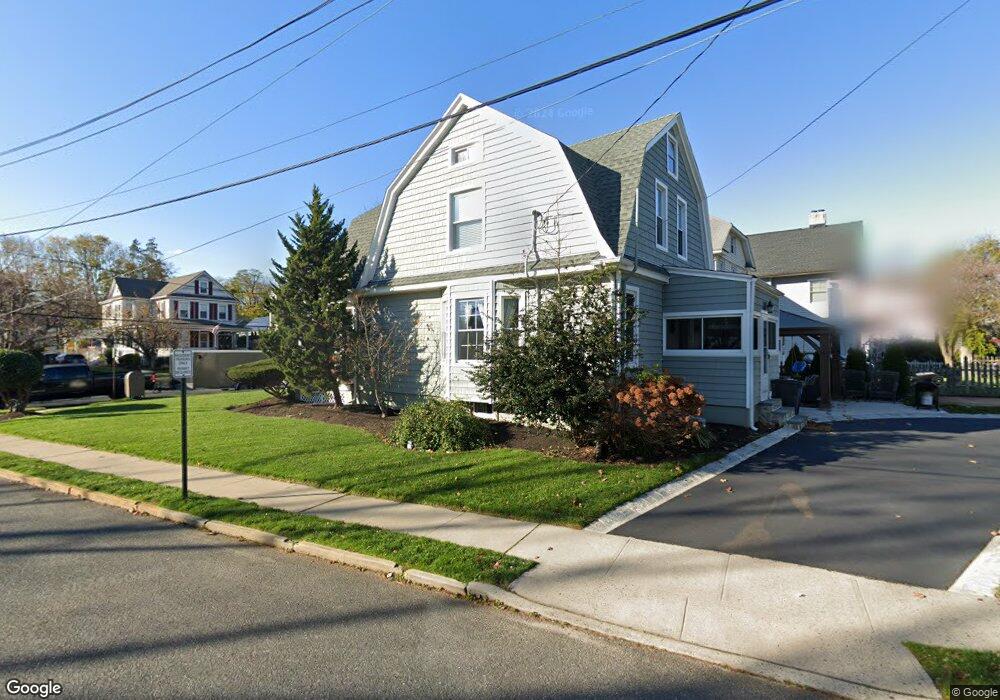
63 South St Red Bank, NJ 07701
Estimated Value: $728,000 - $859,000
3
Beds
2
Baths
1,466
Sq Ft
$533/Sq Ft
Est. Value
About This Home
This home is located at 63 South St, Red Bank, NJ 07701 and is currently estimated at $781,285, approximately $532 per square foot. 63 South St is a home located in Monmouth County with nearby schools including Red Bank Primary School, Red Bank Middle School, and Red Bank Reg High School.
Ownership History
Date
Name
Owned For
Owner Type
Purchase Details
Closed on
Aug 15, 2011
Sold by
Digaletos John
Bought by
Katzgrau Kenneth and Katzgrau Kathryne
Current Estimated Value
Home Financials for this Owner
Home Financials are based on the most recent Mortgage that was taken out on this home.
Original Mortgage
$288,000
Outstanding Balance
$199,035
Interest Rate
4.53%
Mortgage Type
New Conventional
Estimated Equity
$582,250
Create a Home Valuation Report for This Property
The Home Valuation Report is an in-depth analysis detailing your home's value as well as a comparison with similar homes in the area
Home Values in the Area
Average Home Value in this Area
Purchase History
| Date | Buyer | Sale Price | Title Company |
|---|---|---|---|
| Katzgrau Kenneth | $360,000 | Chicago Title Insurance Co |
Source: Public Records
Mortgage History
| Date | Status | Borrower | Loan Amount |
|---|---|---|---|
| Open | Katzgrau Kenneth | $288,000 |
Source: Public Records
Tax History Compared to Growth
Tax History
| Year | Tax Paid | Tax Assessment Tax Assessment Total Assessment is a certain percentage of the fair market value that is determined by local assessors to be the total taxable value of land and additions on the property. | Land | Improvement |
|---|---|---|---|---|
| 2025 | $11,428 | $705,800 | $437,700 | $268,100 |
| 2024 | $11,084 | $605,000 | $347,700 | $257,300 |
| 2023 | $11,084 | $580,000 | $347,700 | $232,300 |
| 2022 | $10,125 | $517,700 | $295,400 | $222,300 |
| 2021 | $10,125 | $452,600 | $256,900 | $195,700 |
| 2020 | $9,895 | $435,500 | $256,900 | $178,600 |
| 2019 | $9,512 | $430,200 | $256,900 | $173,300 |
| 2018 | $9,269 | $423,800 | $256,900 | $166,900 |
| 2017 | $8,919 | $422,700 | $256,900 | $165,800 |
| 2016 | $8,150 | $386,800 | $225,300 | $161,500 |
| 2015 | $7,746 | $381,000 | $269,200 | $111,800 |
| 2014 | $8,191 | $428,200 | $305,300 | $122,900 |
Source: Public Records
Map
Nearby Homes
- 137 E Bergen Place
- 26 Pinckney Rd Unit C
- 27 Irving Place
- 17 Leroy Place Unit 3B
- 17 Leroy Place Unit 1C
- 123 Manor Dr
- 44 Waverly Place
- 283 Spring St Unit 3A
- 205 Maple Ave
- 82 Manor Dr Unit 803
- 88 Manor Dr Unit 809
- 68 Ambassador Dr
- 12 Garden Rd
- 82 Linden Place
- 65 Manor Dr
- 199 Pinckney Rd
- 184 Manor E Unit 184
- 85 Tower Hill Dr Unit 608
- 23 Wallace St Unit 207
- 253 Pearl St S