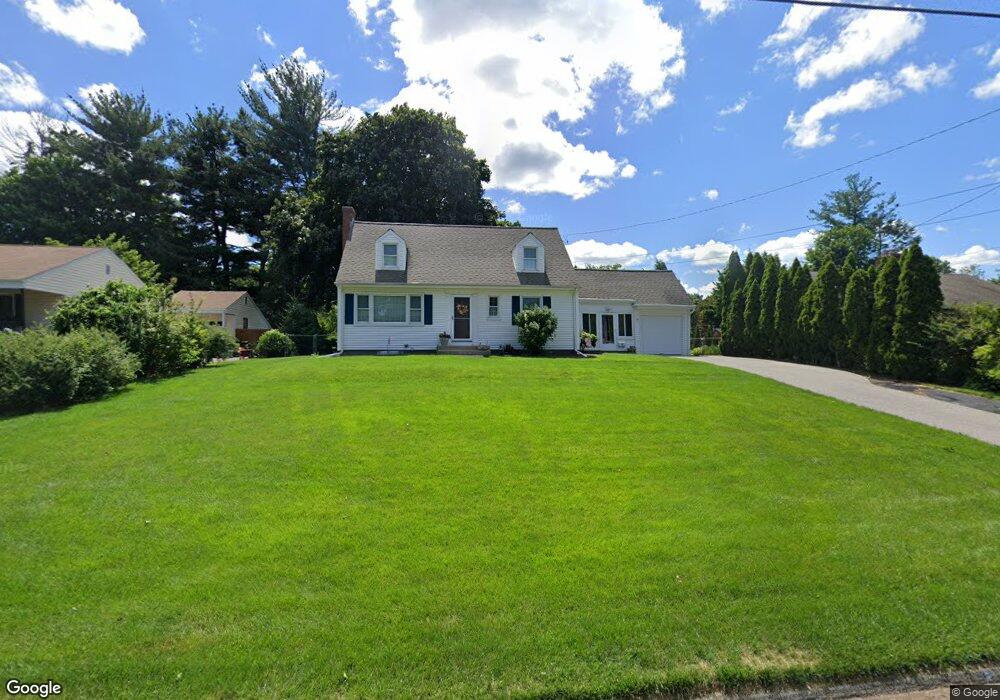
63 Southwell Rd Wethersfield, CT 06109
Estimated Value: $388,000 - $443,000
3
Beds
2
Baths
1,296
Sq Ft
$314/Sq Ft
Est. Value
About This Home
This home is located at 63 Southwell Rd, Wethersfield, CT 06109 and is currently estimated at $406,559, approximately $313 per square foot. 63 Southwell Rd is a home located in Hartford County with nearby schools including Emerson-Williams School, Woodcrest Elementary School, and Silas Deane Middle School.
Ownership History
Date
Name
Owned For
Owner Type
Purchase Details
Closed on
Apr 28, 1995
Sold by
Jeoesbury Harold J and Joesbury Teresa A
Bought by
Brazel Michelle L and Moquin David Albion
Current Estimated Value
Home Financials for this Owner
Home Financials are based on the most recent Mortgage that was taken out on this home.
Original Mortgage
$110,000
Interest Rate
8.33%
Mortgage Type
Unknown
Create a Home Valuation Report for This Property
The Home Valuation Report is an in-depth analysis detailing your home's value as well as a comparison with similar homes in the area
Home Values in the Area
Average Home Value in this Area
Purchase History
| Date | Buyer | Sale Price | Title Company |
|---|---|---|---|
| Brazel Michelle L | $155,000 | -- |
Source: Public Records
Mortgage History
| Date | Status | Borrower | Loan Amount |
|---|---|---|---|
| Open | Brazel Michelle L | $170,000 | |
| Closed | Brazel Michelle L | $174,000 | |
| Closed | Brazel Michelle L | $30,000 | |
| Closed | Brazel Michelle L | $110,000 |
Source: Public Records
Tax History Compared to Growth
Tax History
| Year | Tax Paid | Tax Assessment Tax Assessment Total Assessment is a certain percentage of the fair market value that is determined by local assessors to be the total taxable value of land and additions on the property. | Land | Improvement |
|---|---|---|---|---|
| 2025 | $10,414 | $252,650 | $96,610 | $156,040 |
| 2024 | $6,739 | $155,920 | $73,500 | $82,420 |
| 2023 | $6,514 | $155,920 | $73,500 | $82,420 |
| 2022 | $6,331 | $154,120 | $73,500 | $80,620 |
| 2021 | $6,268 | $154,120 | $73,500 | $80,620 |
| 2020 | $6,271 | $154,120 | $73,500 | $80,620 |
| 2019 | $6,279 | $154,120 | $73,500 | $80,620 |
| 2018 | $6,533 | $160,200 | $72,800 | $87,400 |
| 2017 | $6,371 | $160,200 | $72,800 | $87,400 |
| 2016 | $6,174 | $160,200 | $72,800 | $87,400 |
| 2015 | $6,118 | $160,200 | $72,800 | $87,400 |
| 2014 | $5,886 | $160,200 | $72,800 | $87,400 |
Source: Public Records
Map
Nearby Homes