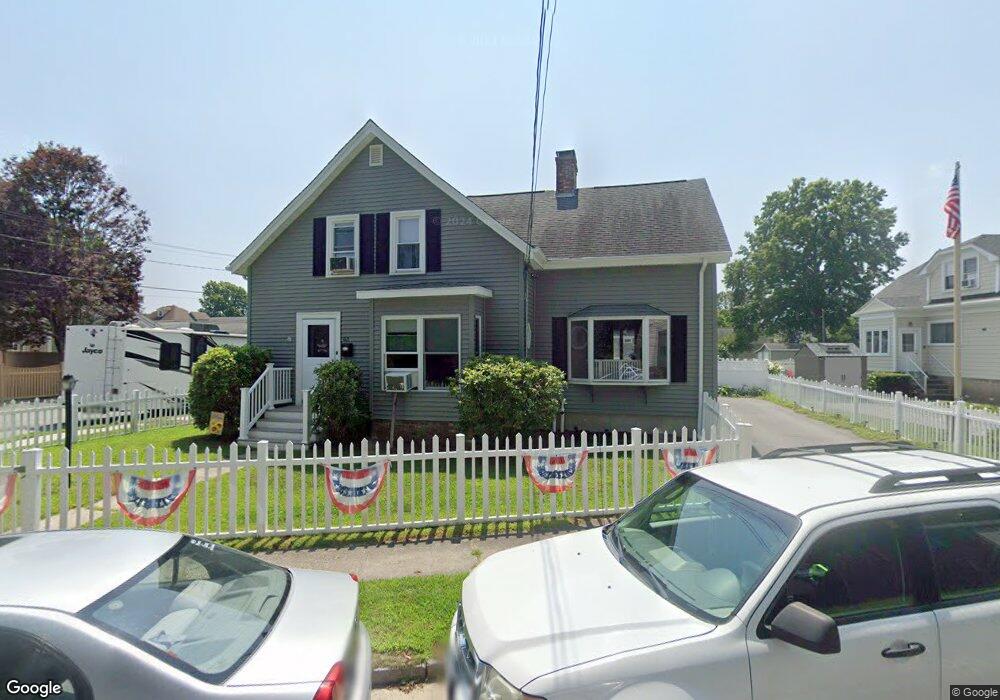
63 Spring St Fairhaven, MA 02719
Estimated Value: $444,000 - $610,000
4
Beds
1
Bath
2,001
Sq Ft
$260/Sq Ft
Est. Value
About This Home
This home is located at 63 Spring St, Fairhaven, MA 02719 and is currently estimated at $519,580, approximately $259 per square foot. 63 Spring St is a home located in Bristol County with nearby schools including Fairhaven High School, City On A Hill Charter Public School New Bedford, and St. Joseph School.
Ownership History
Date
Name
Owned For
Owner Type
Purchase Details
Closed on
May 19, 1994
Sold by
First Fsb Amer
Bought by
Presby Thomas W and Presby Lisa A
Current Estimated Value
Home Financials for this Owner
Home Financials are based on the most recent Mortgage that was taken out on this home.
Original Mortgage
$111,150
Interest Rate
8.44%
Mortgage Type
Purchase Money Mortgage
Purchase Details
Closed on
Aug 16, 1993
Sold by
Smith Michael T
Bought by
First Fed Sb America
Create a Home Valuation Report for This Property
The Home Valuation Report is an in-depth analysis detailing your home's value as well as a comparison with similar homes in the area
Home Values in the Area
Average Home Value in this Area
Purchase History
| Date | Buyer | Sale Price | Title Company |
|---|---|---|---|
| Presby Thomas W | $109,000 | -- | |
| First Fed Sb America | $109,000 | -- |
Source: Public Records
Mortgage History
| Date | Status | Borrower | Loan Amount |
|---|---|---|---|
| Open | First Fed Sb America | $126,000 | |
| Closed | First Fed Sb America | $135,000 | |
| Closed | First Fed Sb America | $111,150 | |
| Previous Owner | First Fed Sb America | $96,000 |
Source: Public Records
Tax History Compared to Growth
Tax History
| Year | Tax Paid | Tax Assessment Tax Assessment Total Assessment is a certain percentage of the fair market value that is determined by local assessors to be the total taxable value of land and additions on the property. | Land | Improvement |
|---|---|---|---|---|
| 2025 | $34 | $366,300 | $171,500 | $194,800 |
| 2024 | $3,287 | $356,100 | $171,500 | $184,600 |
| 2023 | $3,223 | $323,900 | $150,200 | $173,700 |
| 2022 | $3,127 | $306,000 | $139,600 | $166,400 |
| 2021 | $2,960 | $262,200 | $126,300 | $135,900 |
| 2020 | $2,900 | $262,200 | $126,300 | $135,900 |
| 2019 | $2,683 | $229,900 | $104,800 | $125,100 |
| 2018 | $3,366 | $220,400 | $99,700 | $120,700 |
| 2017 | $2,569 | $213,400 | $99,700 | $113,700 |
| 2016 | $2,484 | $203,900 | $99,700 | $104,200 |
| 2015 | $2,415 | $198,800 | $99,700 | $99,100 |
Source: Public Records
Map
Nearby Homes
- 145 Pleasant St
- 77 Adams St
- 133 Pleasant St
- 81 Washington St
- 58 Washington St
- 0 Nulands Neck Unit 73286360
- 77 Main St
- 9 Rochambeau St
- 16 Ash St
- 8 Washington St
- 230 Green St
- 24 Middle St
- 17 Middle St
- 181 Washington St
- 11 Lawton St
- 2 Washburn Ave
- 32 Green St
- 32 Cedar St
- 5 Laura Ln
- 33 Narragansett Blvd