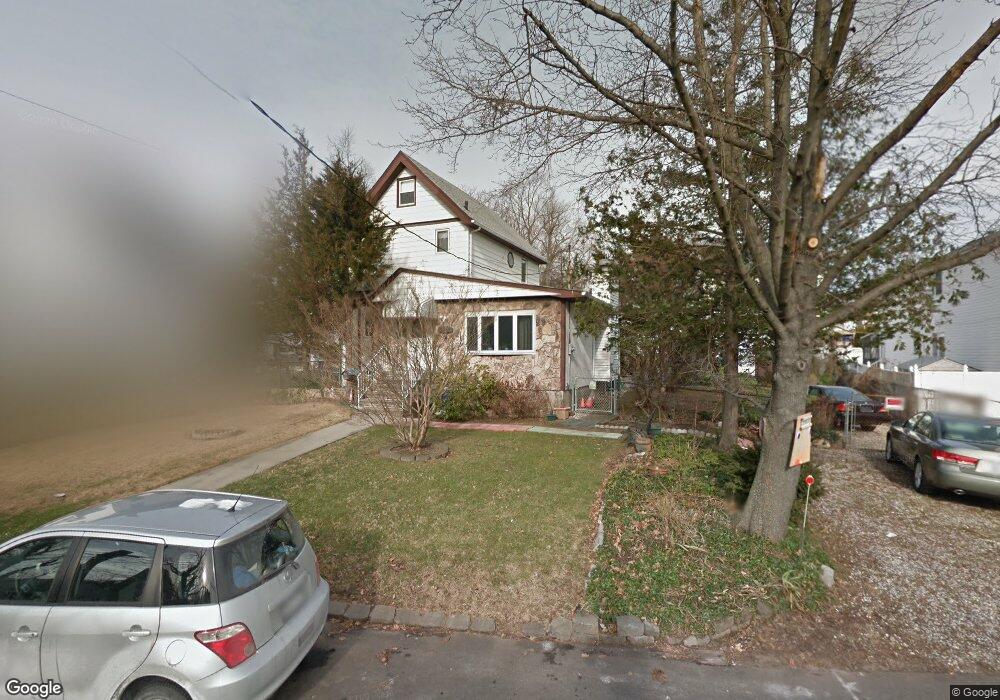
63 Station Ave Staten Island, NY 10309
Pleasant Plains NeighborhoodEstimated Value: $772,000 - $840,000
3
Beds
2
Baths
1,660
Sq Ft
$488/Sq Ft
Est. Value
About This Home
This home is located at 63 Station Ave, Staten Island, NY 10309 and is currently estimated at $809,628, approximately $487 per square foot. 63 Station Ave is a home located in Richmond County with nearby schools including P.S. 3 - The Margaret Gioiosa School, Is 34 Tottenville, and Tottenville High School.
Ownership History
Date
Name
Owned For
Owner Type
Purchase Details
Closed on
Dec 9, 2020
Sold by
Stroh Robert
Bought by
Stroh Robert and Stroh Heather
Current Estimated Value
Home Financials for this Owner
Home Financials are based on the most recent Mortgage that was taken out on this home.
Original Mortgage
$441,595
Outstanding Balance
$392,443
Interest Rate
2.6%
Mortgage Type
FHA
Estimated Equity
$417,185
Purchase Details
Closed on
Jun 2, 2017
Sold by
Peerson Deborah A
Bought by
Stroh Robert
Home Financials for this Owner
Home Financials are based on the most recent Mortgage that was taken out on this home.
Original Mortgage
$362,000
Interest Rate
4.02%
Mortgage Type
New Conventional
Purchase Details
Closed on
Sep 8, 2016
Sold by
Stroh Elizabeth L and Stroh Stephen
Bought by
Stroh Elizabeth L
Purchase Details
Closed on
Aug 21, 2009
Sold by
Stroh Elizabeth L
Bought by
Stroh Elizabeth L and Stroh Stephen
Create a Home Valuation Report for This Property
The Home Valuation Report is an in-depth analysis detailing your home's value as well as a comparison with similar homes in the area
Home Values in the Area
Average Home Value in this Area
Purchase History
| Date | Buyer | Sale Price | Title Company |
|---|---|---|---|
| Stroh Robert | -- | Security Ttl Guarantee Corp | |
| Stroh Robert | $510,000 | None Available | |
| Stroh Elizabeth L | -- | None Available | |
| Stroh Elizabeth L | -- | Stewart Title Insurance Co |
Source: Public Records
Mortgage History
| Date | Status | Borrower | Loan Amount |
|---|---|---|---|
| Open | Stroh Robert | $441,595 | |
| Closed | Stroh Robert | $362,000 |
Source: Public Records
Tax History Compared to Growth
Tax History
| Year | Tax Paid | Tax Assessment Tax Assessment Total Assessment is a certain percentage of the fair market value that is determined by local assessors to be the total taxable value of land and additions on the property. | Land | Improvement |
|---|---|---|---|---|
| 2025 | $5,440 | $48,960 | $8,711 | $40,249 |
| 2024 | $5,440 | $40,020 | $10,071 | $29,949 |
| 2023 | $5,239 | $25,795 | $8,160 | $17,635 |
| 2022 | $5,149 | $40,080 | $14,880 | $25,200 |
| 2021 | $5,157 | $40,500 | $14,880 | $25,620 |
| 2020 | $5,056 | $39,000 | $14,880 | $24,120 |
| 2019 | $4,722 | $37,320 | $14,880 | $22,440 |
| 2018 | $2,191 | $21,496 | $8,975 | $12,521 |
| 2017 | $4,095 | $21,496 | $10,726 | $10,770 |
| 2016 | $1,290 | $20,420 | $10,821 | $9,599 |
| 2015 | $1,084 | $19,905 | $8,495 | $11,410 |
| 2014 | $1,084 | $18,810 | $9,140 | $9,670 |
Source: Public Records
Map
Nearby Homes
- 95 Station Ave
- 66 Pleasant Plains Ave
- 26 Station Ave
- 52 Pleasant Plains Ave
- 28 Hallister St
- 6321 Amboy Rd
- 6401 Amboy Rd
- 6384 Amboy Rd
- 35 Savona Ct
- 36 Savona Ct
- 52 Cranberry Ct
- 6233 Amboy Rd
- 94 Sharrott Ave Unit 100
- 20 Cordelia Ave
- 75 Churchill Ave
- 6136 Amboy Rd
- 105 Churchill Ave
- 79 S Goff Ave Unit B
- 116 Churchill Ave
- 6716 Amboy Rd
- 57 Station Ave
- 67 Station Ave
- 55 Station Ave
- 71 Station Ave
- 51 Station Ave
- 74 Pleasant Plains Ave
- 78 Pleasant Plains Ave
- 92 Pleasant Plains Ave
- 70 Pleasant Plains Ave
- 81 Station Ave
- 45 Station Ave
- 96 Pleasant Plains Ave
- 70 Station Ave
- 56 Station Ave
- 52 Station Ave
- 39 Station Ave
- 39 Station Ave Unit 2
- 76 Station Ave
- 50 Station Ave
- 83 Station Ave