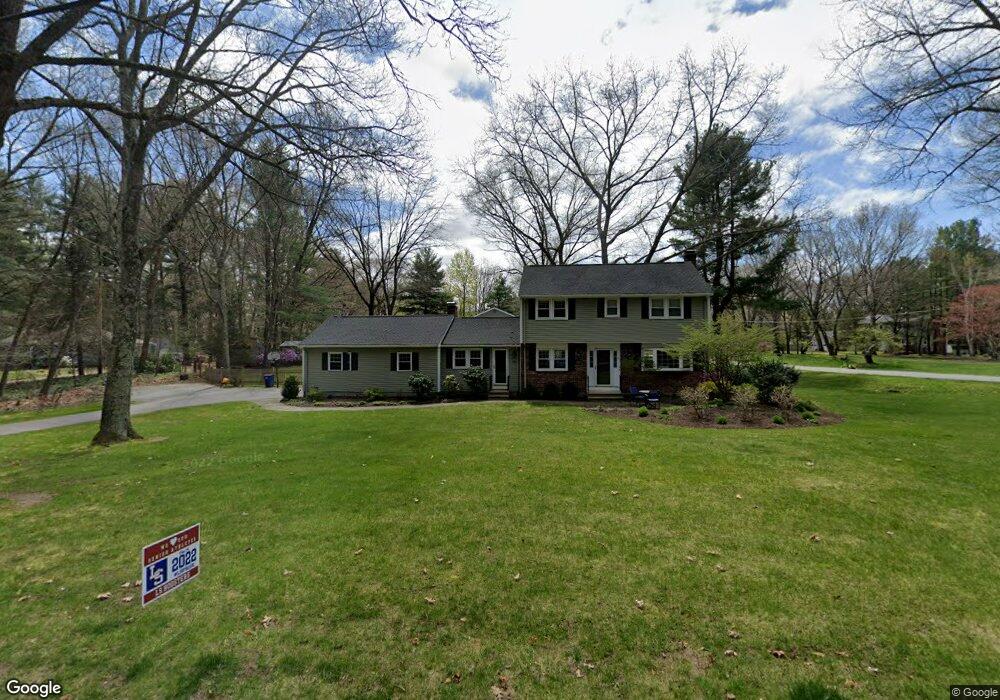
63 Stock Farm Rd Sudbury, MA 01776
Estimated Value: $976,000 - $1,370,000
4
Beds
3
Baths
2,309
Sq Ft
$488/Sq Ft
Est. Value
About This Home
This home is located at 63 Stock Farm Rd, Sudbury, MA 01776 and is currently estimated at $1,127,479, approximately $488 per square foot. 63 Stock Farm Rd is a home located in Middlesex County with nearby schools including Israel Loring Elementary School, Ephraim Curtis Middle School, and Lincoln-Sudbury Regional High School.
Ownership History
Date
Name
Owned For
Owner Type
Purchase Details
Closed on
Apr 18, 2007
Sold by
Thoren Heidi L
Bought by
Ward David R and Thoren Heidi L
Current Estimated Value
Home Financials for this Owner
Home Financials are based on the most recent Mortgage that was taken out on this home.
Original Mortgage
$363,000
Interest Rate
6.19%
Mortgage Type
Purchase Money Mortgage
Purchase Details
Closed on
Jul 28, 2006
Sold by
Sullivan David and Sullivan Karen
Bought by
Thoren Heidi L and Orourke Kristen L
Home Financials for this Owner
Home Financials are based on the most recent Mortgage that was taken out on this home.
Original Mortgage
$365,000
Interest Rate
6.67%
Mortgage Type
Purchase Money Mortgage
Purchase Details
Closed on
May 11, 1998
Sold by
Mcgourty Geraldine C
Bought by
Sullivan David and Stone Karen
Create a Home Valuation Report for This Property
The Home Valuation Report is an in-depth analysis detailing your home's value as well as a comparison with similar homes in the area
Home Values in the Area
Average Home Value in this Area
Purchase History
| Date | Buyer | Sale Price | Title Company |
|---|---|---|---|
| Ward David R | -- | -- | |
| Thoren Heidi L | $658,500 | -- | |
| Sullivan David | $350,000 | -- |
Source: Public Records
Mortgage History
| Date | Status | Borrower | Loan Amount |
|---|---|---|---|
| Open | Sullivan David | $343,700 | |
| Closed | Ward David R | $363,000 | |
| Previous Owner | Thoren Heidi L | $365,000 | |
| Previous Owner | Sullivan David | $280,000 |
Source: Public Records
Tax History Compared to Growth
Tax History
| Year | Tax Paid | Tax Assessment Tax Assessment Total Assessment is a certain percentage of the fair market value that is determined by local assessors to be the total taxable value of land and additions on the property. | Land | Improvement |
|---|---|---|---|---|
| 2025 | $13,940 | $952,200 | $444,300 | $507,900 |
| 2024 | $13,424 | $918,800 | $431,200 | $487,600 |
| 2023 | $12,771 | $809,800 | $399,200 | $410,600 |
| 2022 | $12,397 | $686,800 | $366,100 | $320,700 |
| 2021 | $12,023 | $638,500 | $366,100 | $272,400 |
| 2020 | $11,780 | $638,500 | $366,100 | $272,400 |
| 2019 | $11,436 | $638,500 | $366,100 | $272,400 |
| 2018 | $11,400 | $635,800 | $385,300 | $250,500 |
| 2017 | $11,158 | $629,000 | $380,700 | $248,300 |
| 2016 | $10,819 | $607,800 | $366,100 | $241,700 |
| 2015 | $10,368 | $589,100 | $351,800 | $237,300 |
| 2014 | $9,958 | $552,300 | $341,400 | $210,900 |
Source: Public Records
Map
Nearby Homes
- 63 Landham Rd
- 0 Wagonwheel Rd
- 216 Landham Rd
- 84 Hopestill Brown Rd
- 353 Old Connecticut Path
- 6 Old County Rd Unit 16
- 30 Edith Rd
- 8 Clara Rd
- 29 Derby St
- 24 Pinewood Dr
- 454 Old Connecticut Path
- 81 Nicholas Rd Unit B
- 71 Nicholas Rd Unit H
- 94 Goodmans Hill Rd
- 14 Francine Rd
- 154 Danforth St
- 23 Massasoit Ave
- 96 Lakeshore Dr
- 96 Lake Shore Dr
- 19 Park Ave