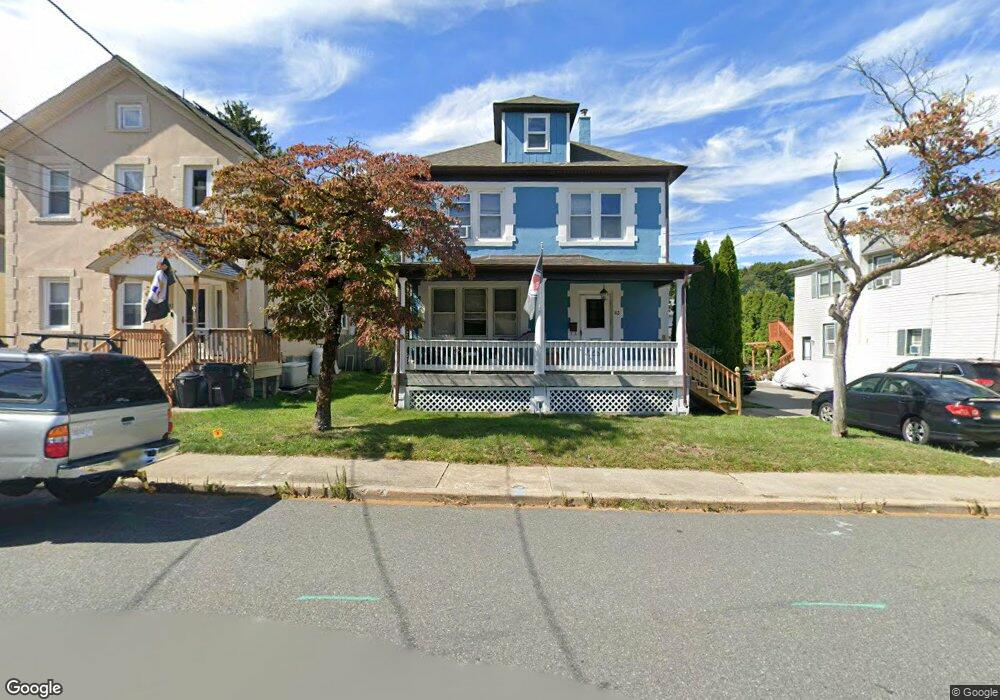
63 Stoll St Netcong, NJ 07857
Estimated Value: $446,000 - $469,000
--
Bed
--
Bath
1,611
Sq Ft
$284/Sq Ft
Est. Value
About This Home
This home is located at 63 Stoll St, Netcong, NJ 07857 and is currently estimated at $457,529, approximately $284 per square foot. 63 Stoll St is a home located in Morris County with nearby schools including Netcong Elementary School and Lenape Val Regional High School.
Ownership History
Date
Name
Owned For
Owner Type
Purchase Details
Closed on
Nov 26, 2012
Sold by
Kramer Allison L
Bought by
Janz Christopher L
Current Estimated Value
Home Financials for this Owner
Home Financials are based on the most recent Mortgage that was taken out on this home.
Original Mortgage
$273,790
Outstanding Balance
$188,616
Interest Rate
3.25%
Mortgage Type
FHA
Estimated Equity
$268,913
Purchase Details
Closed on
Jun 11, 2008
Sold by
Rysiec Leslaw and Rysiec Urszula
Bought by
Janz Christopher L and Kramer Allison L
Home Financials for this Owner
Home Financials are based on the most recent Mortgage that was taken out on this home.
Original Mortgage
$274,050
Interest Rate
6.1%
Mortgage Type
FHA
Purchase Details
Closed on
Jan 5, 1995
Sold by
Mitchell Raymond
Bought by
Rysiez Leelaw and Rysiec Urszula
Home Financials for this Owner
Home Financials are based on the most recent Mortgage that was taken out on this home.
Original Mortgage
$94,000
Interest Rate
9.23%
Create a Home Valuation Report for This Property
The Home Valuation Report is an in-depth analysis detailing your home's value as well as a comparison with similar homes in the area
Home Values in the Area
Average Home Value in this Area
Purchase History
| Date | Buyer | Sale Price | Title Company |
|---|---|---|---|
| Janz Christopher L | -- | First American Title Insuran | |
| Janz Christopher L | $278,350 | None Available | |
| Rysiez Leelaw | $125,000 | -- |
Source: Public Records
Mortgage History
| Date | Status | Borrower | Loan Amount |
|---|---|---|---|
| Open | Janz Christopher L | $273,790 | |
| Previous Owner | Janz Christopher L | $274,050 | |
| Previous Owner | Rysiez Leelaw | $94,000 |
Source: Public Records
Tax History Compared to Growth
Tax History
| Year | Tax Paid | Tax Assessment Tax Assessment Total Assessment is a certain percentage of the fair market value that is determined by local assessors to be the total taxable value of land and additions on the property. | Land | Improvement |
|---|---|---|---|---|
| 2025 | $8,696 | $254,500 | $107,400 | $147,100 |
| 2024 | $8,773 | $254,500 | $107,400 | $147,100 |
| 2023 | $8,773 | $254,500 | $107,400 | $147,100 |
| 2022 | $7,948 | $254,500 | $107,400 | $147,100 |
| 2021 | $7,948 | $254,500 | $107,400 | $147,100 |
| 2020 | $8,742 | $284,200 | $154,000 | $130,200 |
| 2019 | $8,321 | $284,200 | $154,000 | $130,200 |
| 2018 | $7,824 | $284,200 | $154,000 | $130,200 |
| 2017 | $7,517 | $284,200 | $154,000 | $130,200 |
| 2016 | $7,312 | $284,200 | $154,000 | $130,200 |
| 2015 | $7,045 | $284,200 | $154,000 | $130,200 |
| 2014 | $6,738 | $284,200 | $154,000 | $130,200 |
Source: Public Records
Map
Nearby Homes
- 61 Stoll St
- 65 Stoll St
- 59 Stoll St
- 71 Stoll St Unit 73
- 26 Prospect St
- 57 Stoll St
- 24 Prospect St
- 1 Carmine Dr
- 54 Stoll St Unit 13
- 3 Carmine Dr
- 76 Stoll St
- 56 Stoll St Unit 12
- 55 Stoll St
- 22 Prospect St
- 72 Stoll St
- 58 Stoll St
- 60 Stoll St Unit 4
- 60 Stoll St Unit 8
- 60 Stoll St Unit 5
- 60 Stoll St Unit B4