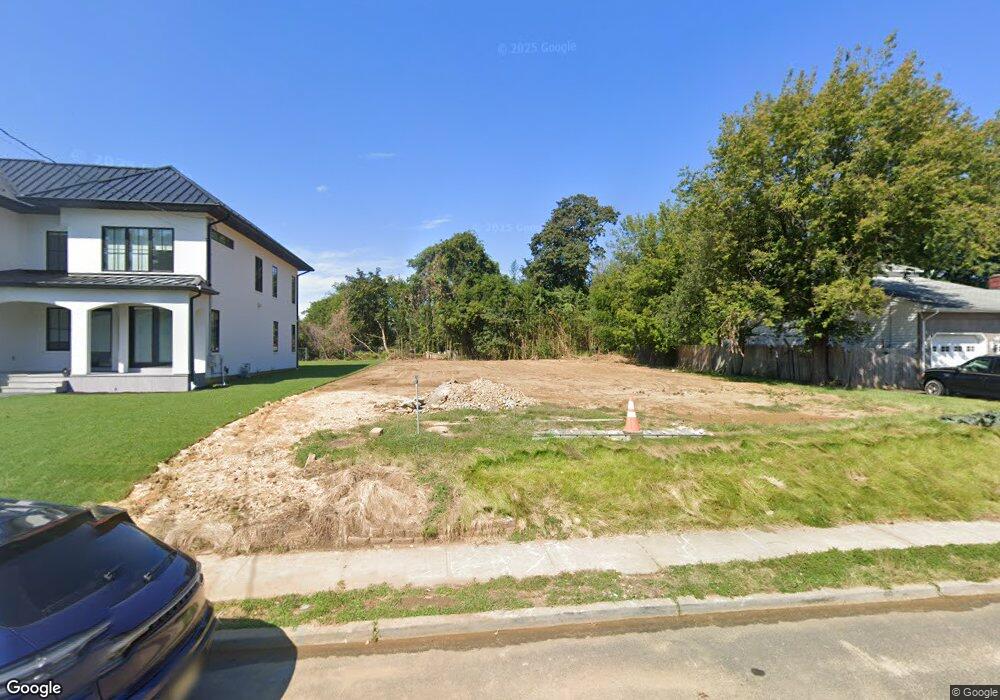
63 Summers Ave West Long Branch, NJ 07764
Estimated Value: $707,004 - $857,000
2
Beds
1
Bath
1,538
Sq Ft
$498/Sq Ft
Est. Value
About This Home
This home is located at 63 Summers Ave, West Long Branch, NJ 07764 and is currently estimated at $765,751, approximately $497 per square foot. 63 Summers Ave is a home located in Monmouth County with nearby schools including Betty McElmon Elementary School, Frank Antonides School, and Shore Regional High School.
Ownership History
Date
Name
Owned For
Owner Type
Purchase Details
Closed on
Aug 29, 2022
Sold by
Clark Chambers
Bought by
Chambers Jeffrey
Current Estimated Value
Purchase Details
Closed on
Dec 31, 2015
Sold by
Chambers Clark D and Chambers Jeffrey
Bought by
Chambers Clark D and Chambers Jeffrey
Purchase Details
Closed on
Nov 2, 2007
Sold by
Dustman Deborah and Vitrano Deborah
Bought by
Chambers Clark D and Chambers Jeffrey
Home Financials for this Owner
Home Financials are based on the most recent Mortgage that was taken out on this home.
Original Mortgage
$292,500
Interest Rate
6.47%
Mortgage Type
Purchase Money Mortgage
Purchase Details
Closed on
May 21, 1999
Sold by
Watts John
Bought by
Vitrano Nick and Vitrano Debroah
Home Financials for this Owner
Home Financials are based on the most recent Mortgage that was taken out on this home.
Original Mortgage
$130,000
Interest Rate
7.19%
Mortgage Type
Purchase Money Mortgage
Create a Home Valuation Report for This Property
The Home Valuation Report is an in-depth analysis detailing your home's value as well as a comparison with similar homes in the area
Home Values in the Area
Average Home Value in this Area
Purchase History
| Date | Buyer | Sale Price | Title Company |
|---|---|---|---|
| Chambers Jeffrey | -- | -- | |
| Chambers Jeffrey | -- | None Listed On Document | |
| Chambers Clark D | -- | First American Title Ins Com | |
| Chambers Clark D | $325,000 | Multiple | |
| Vitrano Nick | $162,500 | -- |
Source: Public Records
Mortgage History
| Date | Status | Borrower | Loan Amount |
|---|---|---|---|
| Previous Owner | Chambers Clark D | $292,500 | |
| Previous Owner | Vitrano Nick | $130,000 |
Source: Public Records
Tax History Compared to Growth
Tax History
| Year | Tax Paid | Tax Assessment Tax Assessment Total Assessment is a certain percentage of the fair market value that is determined by local assessors to be the total taxable value of land and additions on the property. | Land | Improvement |
|---|---|---|---|---|
| 2025 | $7,509 | $597,200 | $419,500 | $177,700 |
| 2024 | $8,145 | $576,300 | $384,700 | $191,600 |
| 2023 | $8,145 | $583,000 | $387,500 | $195,500 |
| 2022 | $6,818 | $441,100 | $255,000 | $186,100 |
| 2021 | $7,425 | $352,700 | $201,300 | $151,400 |
| 2020 | $7,425 | $361,300 | $202,500 | $158,800 |
| 2019 | $7,367 | $360,400 | $202,500 | $157,900 |
| 2018 | $6,940 | $328,000 | $177,500 | $150,500 |
| 2017 | $7,000 | $315,900 | $170,000 | $145,900 |
| 2016 | $7,050 | $324,600 | $205,000 | $119,600 |
| 2015 | $6,934 | $318,800 | $205,000 | $113,800 |
| 2014 | $7,545 | $323,700 | $205,000 | $118,700 |
Source: Public Records
Map
Nearby Homes