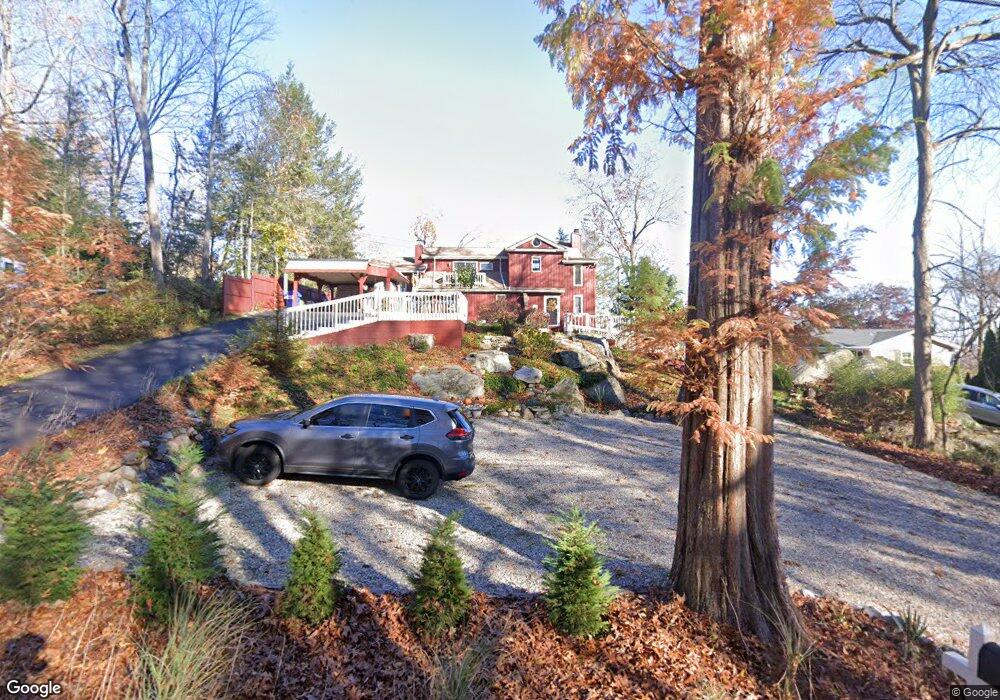
63 Valley View Ln New Milford, CT 06776
Estimated Value: $502,000 - $542,000
3
Beds
3
Baths
1,962
Sq Ft
$267/Sq Ft
Est. Value
About This Home
This home is located at 63 Valley View Ln, New Milford, CT 06776 and is currently estimated at $523,103, approximately $266 per square foot. 63 Valley View Ln is a home located in Litchfield County with nearby schools including Hill And Plain Elementary School, Sarah Noble Intermediate School, and Schaghticoke Middle School.
Ownership History
Date
Name
Owned For
Owner Type
Purchase Details
Closed on
Oct 20, 2011
Sold by
Smialek Jack R and Wolan Anna
Bought by
Smialek Jack R
Current Estimated Value
Home Financials for this Owner
Home Financials are based on the most recent Mortgage that was taken out on this home.
Original Mortgage
$275,372
Outstanding Balance
$189,185
Interest Rate
4.1%
Estimated Equity
$333,918
Purchase Details
Closed on
Mar 8, 2006
Sold by
Pyle John M and Pyle Pamela A
Bought by
Smialek Jack R
Home Financials for this Owner
Home Financials are based on the most recent Mortgage that was taken out on this home.
Original Mortgage
$250,000
Interest Rate
6.15%
Mortgage Type
Purchase Money Mortgage
Purchase Details
Closed on
Apr 3, 2000
Sold by
Englar James and Dehart Tiffany
Bought by
Pyle John and Pyle Pam
Purchase Details
Closed on
Mar 24, 1997
Sold by
Eden Paul and Eden Barbara
Bought by
Englar James W
Create a Home Valuation Report for This Property
The Home Valuation Report is an in-depth analysis detailing your home's value as well as a comparison with similar homes in the area
Home Values in the Area
Average Home Value in this Area
Purchase History
| Date | Buyer | Sale Price | Title Company |
|---|---|---|---|
| Smialek Jack R | -- | -- | |
| Smialek Jack R | $335,000 | -- | |
| Pyle John | $193,000 | -- | |
| Englar James W | $159,000 | -- |
Source: Public Records
Mortgage History
| Date | Status | Borrower | Loan Amount |
|---|---|---|---|
| Open | Englar James W | $275,372 | |
| Previous Owner | Englar James W | $286,500 | |
| Previous Owner | Englar James W | $250,000 |
Source: Public Records
Tax History Compared to Growth
Tax History
| Year | Tax Paid | Tax Assessment Tax Assessment Total Assessment is a certain percentage of the fair market value that is determined by local assessors to be the total taxable value of land and additions on the property. | Land | Improvement |
|---|---|---|---|---|
| 2025 | $9,035 | $189,630 | $45,780 | $143,850 |
| 2024 | $5,645 | $189,630 | $45,780 | $143,850 |
| 2023 | $5,495 | $189,630 | $45,780 | $143,850 |
| 2022 | $5,376 | $189,630 | $45,780 | $143,850 |
| 2021 | $5,304 | $189,630 | $45,780 | $143,850 |
| 2020 | $5,208 | $181,580 | $48,580 | $133,000 |
| 2019 | $5,211 | $181,580 | $48,580 | $133,000 |
| 2018 | $5,115 | $181,580 | $48,580 | $133,000 |
| 2017 | $4,948 | $181,580 | $48,580 | $133,000 |
| 2016 | $4,861 | $181,580 | $48,580 | $133,000 |
| 2015 | $5,243 | $196,000 | $48,580 | $147,420 |
| 2014 | $5,155 | $196,000 | $48,580 | $147,420 |
Source: Public Records
Map
Nearby Homes
- 47 Valley View Ln
- 145 Sherry Ln
- 4 Beachside Dr
- 80 Perry Dr
- 440 Candlewood Lake Rd N
- 34 Sherry Ln
- 31 Sullivan Farm
- 43 Sullivan Farm
- 2 Sullivan Farm Unit 2
- 98 Sullivan Farm
- 35 Skyline Dr
- 331 Willow Springs Unit 331
- 7 Sunset Dr
- 60 Erickson Rd
- 7 Morey Rd
- 7 Eagle Dr
- 17 Haviland Rd
- 17 Lakewood Terrace
- 19 June Rd
- 6 Red Cedar Dr
- 65 Valley View Ln
- 61 Valley View Ln
- 67 Valley View Ln
- 57 Valley View Ln
- 493 Candlewood Lake Rd N
- 497 Candlewood Lake Rd N
- 62 Valley View Ln
- 503 Candlewood Lake Rd N
- 115 Sherry Ln
- 53 Valley View Ln
- 506 Candlewood Lake Rd N
- 507 Candlewood Lake Rd N
- 72 Valley View Ln
- 508 Candlewood Lake Rd N
- 51 Valley View Ln
- 73 Valley View Ln
- 509 Candlewood Lake Rd N
- 117 Sherry Ln
- 510 Candlewood Lake Rd N
- 121 Sherry Ln