Estimated Value: $446,506 - $508,000
5
Beds
3
Baths
2,066
Sq Ft
$232/Sq Ft
Est. Value
About This Home
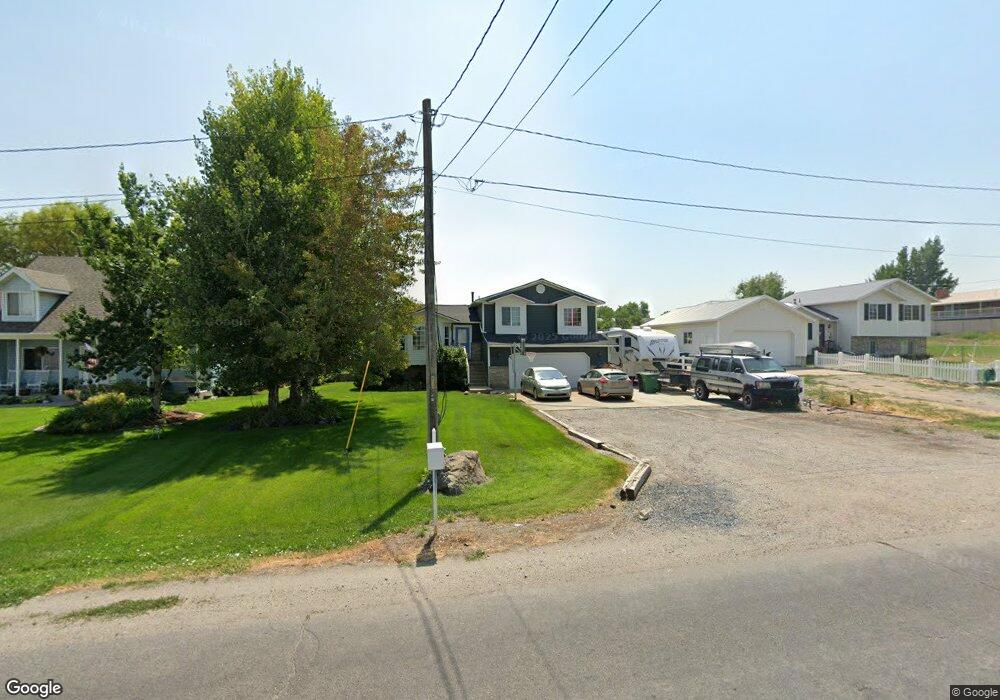
This home is located at 63 W 300 N, Hyrum, UT 84319 and is currently estimated at $479,627, approximately $232 per square foot. 63 W 300 N is a home located in Cache County with nearby schools including Lincoln School, South Cache Middle School, and Mountain Crest High School.
Ownership History
Date
Name
Owned For
Owner Type
Purchase Details
Closed on
Nov 24, 2021
Sold by
Wiberg Marcy
Bought by
Sharp Carson Kent
Current Estimated Value
Home Financials for this Owner
Home Financials are based on the most recent Mortgage that was taken out on this home.
Original Mortgage
$364,500
Outstanding Balance
$334,003
Interest Rate
3.14%
Mortgage Type
New Conventional
Estimated Equity
$145,624
Purchase Details
Closed on
Aug 2, 2017
Sold by
Wiberg Joshua and Wiberg Marcy
Bought by
Wiberg Marcy
Purchase Details
Closed on
Jun 30, 2006
Sold by
Digerness Cindi
Bought by
Wiberg Joshua and Wiberg Marcy
Home Financials for this Owner
Home Financials are based on the most recent Mortgage that was taken out on this home.
Original Mortgage
$112,000
Interest Rate
6.57%
Mortgage Type
New Conventional
Purchase Details
Closed on
Apr 24, 2001
Sold by
Shepherd Jack M
Bought by
Firstar Bank Milwaukee Na and Salomon Brothers Mtg Securities Vii Floa
Create a Home Valuation Report for This Property
The Home Valuation Report is an in-depth analysis detailing your home's value as well as a comparison with similar homes in the area
Home Values in the Area
Average Home Value in this Area
Purchase History
| Date | Buyer | Sale Price | Title Company |
|---|---|---|---|
| Sharp Carson Kent | -- | Cache Title Logan | |
| Wiberg Marcy | -- | None Available | |
| Wiberg Joshua | -- | Northern Title Company | |
| Firstar Bank Milwaukee Na | $116,000 | -- |
Source: Public Records
Mortgage History
| Date | Status | Borrower | Loan Amount |
|---|---|---|---|
| Open | Sharp Carson Kent | $364,500 | |
| Previous Owner | Wiberg Joshua | $112,000 |
Source: Public Records
Tax History Compared to Growth
Tax History
| Year | Tax Paid | Tax Assessment Tax Assessment Total Assessment is a certain percentage of the fair market value that is determined by local assessors to be the total taxable value of land and additions on the property. | Land | Improvement |
|---|---|---|---|---|
| 2025 | $1,649 | $236,765 | $0 | $0 |
| 2024 | $1,758 | $235,770 | $0 | $0 |
| 2023 | $1,745 | $223,735 | $0 | $0 |
| 2022 | $1,821 | $223,735 | $0 | $0 |
| 2021 | $1,487 | $281,490 | $71,490 | $210,000 |
| 2020 | $1,329 | $236,066 | $71,490 | $164,576 |
| 2019 | $1,290 | $215,446 | $50,870 | $164,576 |
| 2018 | $1,201 | $193,980 | $50,870 | $143,110 |
| 2017 | $1,188 | $99,535 | $0 | $0 |
| 2016 | $1,214 | $99,535 | $0 | $0 |
| 2015 | $1,045 | $85,460 | $0 | $0 |
| 2014 | $1,020 | $85,295 | $0 | $0 |
| 2013 | -- | $85,295 | $0 | $0 |
Source: Public Records
Map
Nearby Homes