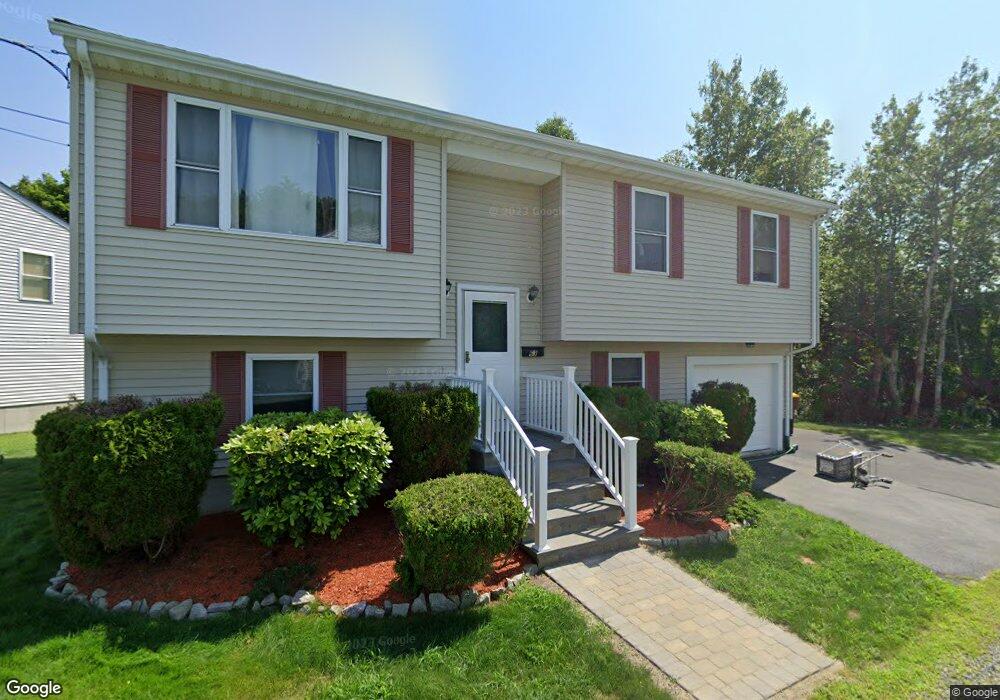
63 Watson Way Fall River, MA 02721
Maplewood NeighborhoodEstimated Value: $471,499 - $500,000
3
Beds
2
Baths
1,726
Sq Ft
$279/Sq Ft
Est. Value
About This Home
This home is located at 63 Watson Way, Fall River, MA 02721 and is currently estimated at $481,125, approximately $278 per square foot. 63 Watson Way is a home located in Bristol County with nearby schools including Henry Lord Community School, B M C Durfee High School, and Argosy Collegiate Charter School.
Ownership History
Date
Name
Owned For
Owner Type
Purchase Details
Closed on
Apr 20, 2016
Sold by
Mcclam Jonathan J and Mcclam Sow F
Bought by
Mcclam Rita and Mcclam Jonathan J
Current Estimated Value
Purchase Details
Closed on
Sep 20, 1996
Sold by
Well Built Homes Inc
Bought by
Meclam Jonathan J and Fong Sow
Home Financials for this Owner
Home Financials are based on the most recent Mortgage that was taken out on this home.
Original Mortgage
$117,300
Interest Rate
7.89%
Mortgage Type
Purchase Money Mortgage
Create a Home Valuation Report for This Property
The Home Valuation Report is an in-depth analysis detailing your home's value as well as a comparison with similar homes in the area
Home Values in the Area
Average Home Value in this Area
Purchase History
| Date | Buyer | Sale Price | Title Company |
|---|---|---|---|
| Mcclam Rita | -- | -- | |
| Meclam Jonathan J | $115,000 | -- |
Source: Public Records
Mortgage History
| Date | Status | Borrower | Loan Amount |
|---|---|---|---|
| Previous Owner | Meclam Jonathan J | $76,000 | |
| Previous Owner | Meclam Jonathan J | $117,300 |
Source: Public Records
Tax History
| Year | Tax Paid | Tax Assessment Tax Assessment Total Assessment is a certain percentage of the fair market value that is determined by local assessors to be the total taxable value of land and additions on the property. | Land | Improvement |
|---|---|---|---|---|
| 2025 | $4,719 | $412,100 | $119,800 | $292,300 |
| 2024 | $4,219 | $367,200 | $117,400 | $249,800 |
| 2023 | $4,209 | $343,000 | $105,800 | $237,200 |
| 2022 | $3,601 | $292,000 | $99,800 | $192,200 |
| 2021 | $3,601 | $260,400 | $95,400 | $165,000 |
| 2020 | $3,504 | $242,500 | $91,000 | $151,500 |
| 2019 | $3,595 | $246,600 | $95,100 | $151,500 |
| 2018 | $3,341 | $228,500 | $95,800 | $132,700 |
| 2017 | $2,992 | $213,700 | $95,800 | $117,900 |
| 2016 | $2,761 | $202,600 | $98,800 | $103,800 |
| 2015 | $2,685 | $205,300 | $98,800 | $106,500 |
| 2014 | $2,583 | $205,300 | $98,800 | $106,500 |
Source: Public Records
Map
Nearby Homes
Your Personal Tour Guide
Ask me questions while you tour the home.