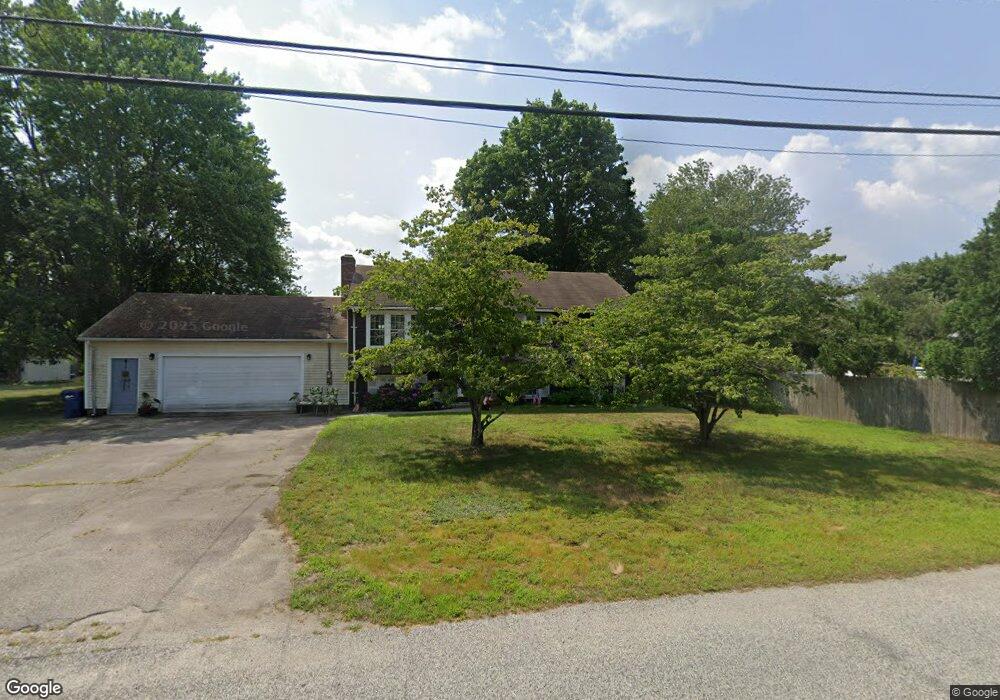
63 Willard Ave Seekonk, MA 02771
Estimated Value: $487,337 - $598,000
3
Beds
2
Baths
1,028
Sq Ft
$512/Sq Ft
Est. Value
About This Home
This home is located at 63 Willard Ave, Seekonk, MA 02771 and is currently estimated at $526,834, approximately $512 per square foot. 63 Willard Ave is a home located in Bristol County with nearby schools including Seekonk High School, St Mary Academy-Bay View, and Providence Country Day School.
Ownership History
Date
Name
Owned For
Owner Type
Purchase Details
Closed on
Jan 15, 2014
Sold by
Hall Elaine M
Bought by
Hall Elaine M and Hall Michael J
Current Estimated Value
Home Financials for this Owner
Home Financials are based on the most recent Mortgage that was taken out on this home.
Original Mortgage
$216,218
Outstanding Balance
$162,351
Interest Rate
4.25%
Mortgage Type
FHA
Estimated Equity
$364,483
Purchase Details
Closed on
Jun 15, 2012
Sold by
Hall Michael J and Hall Elaine M
Bought by
Hall Elaine M
Purchase Details
Closed on
Jan 1, 1979
Bought by
Hall Elaine M and Hall Michael John
Create a Home Valuation Report for This Property
The Home Valuation Report is an in-depth analysis detailing your home's value as well as a comparison with similar homes in the area
Home Values in the Area
Average Home Value in this Area
Purchase History
| Date | Buyer | Sale Price | Title Company |
|---|---|---|---|
| Hall Elaine M | -- | -- | |
| Hall Elaine M | -- | -- | |
| Hall Elaine M | -- | -- |
Source: Public Records
Mortgage History
| Date | Status | Borrower | Loan Amount |
|---|---|---|---|
| Open | Hall Elaine M | $216,218 | |
| Previous Owner | Hall Elaine M | $125,000 | |
| Previous Owner | Hall Elaine M | $20,000 |
Source: Public Records
Tax History Compared to Growth
Tax History
| Year | Tax Paid | Tax Assessment Tax Assessment Total Assessment is a certain percentage of the fair market value that is determined by local assessors to be the total taxable value of land and additions on the property. | Land | Improvement |
|---|---|---|---|---|
| 2025 | $5,001 | $404,900 | $160,500 | $244,400 |
| 2024 | $4,826 | $390,800 | $160,500 | $230,300 |
| 2023 | $4,535 | $345,900 | $143,500 | $202,400 |
| 2022 | $4,146 | $310,800 | $137,900 | $172,900 |
| 2021 | $3,965 | $292,200 | $122,200 | $170,000 |
| 2020 | $3,840 | $291,600 | $122,100 | $169,500 |
| 2019 | $3,727 | $285,400 | $122,100 | $163,300 |
| 2018 | $3,699 | $277,100 | $122,100 | $155,000 |
| 2017 | $3,501 | $260,100 | $116,900 | $143,200 |
| 2016 | $3,469 | $258,700 | $116,900 | $141,800 |
| 2015 | $3,401 | $257,100 | $116,900 | $140,200 |
Source: Public Records
Map
Nearby Homes