630 8th St Wilmette, IL 60091
Estimated Value: $1,963,558 - $2,446,000
4
Beds
3
Baths
3,476
Sq Ft
$632/Sq Ft
Est. Value
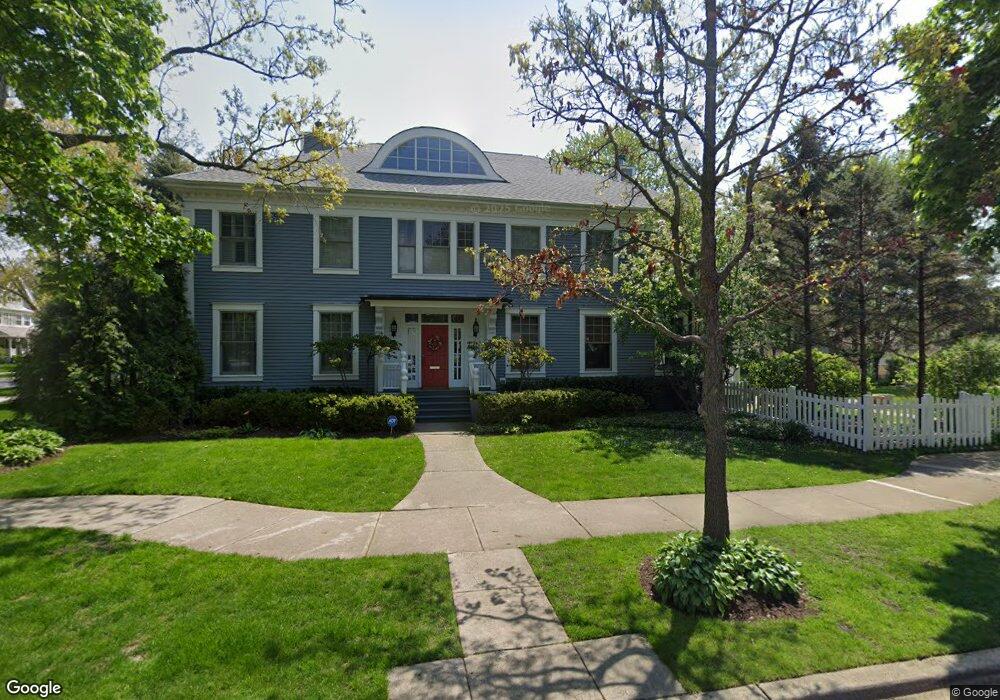
About This Home
This home is located at 630 8th St, Wilmette, IL 60091 and is currently estimated at $2,198,140, approximately $632 per square foot. 630 8th St is a home located in Cook County with nearby schools including Central Elementary School, Highcrest Middle School, and Wilmette Junior High School.
Ownership History
Date
Name
Owned For
Owner Type
Purchase Details
Closed on
Apr 21, 2015
Sold by
Lyman James H and Lyman Mary R
Bought by
Lyman James H and Lyman Mary R
Current Estimated Value
Purchase Details
Closed on
Jun 20, 2000
Sold by
Townsend Raymond J and Osterhaus Jane T
Bought by
Lyman James H and Lyman Mary R
Home Financials for this Owner
Home Financials are based on the most recent Mortgage that was taken out on this home.
Original Mortgage
$960,000
Outstanding Balance
$318,560
Interest Rate
8%
Estimated Equity
$1,879,580
Purchase Details
Closed on
Jun 22, 1998
Sold by
Chicago Title Trust Land Trust Company
Bought by
Townsend Raymond J and Osterhaus Jane T
Home Financials for this Owner
Home Financials are based on the most recent Mortgage that was taken out on this home.
Original Mortgage
$983,600
Interest Rate
7%
Purchase Details
Closed on
Oct 1, 1997
Sold by
Oneill Peter E and Oneill Ruth V
Bought by
The Chicago Trust Company and Trust #1099365
Create a Home Valuation Report for This Property
The Home Valuation Report is an in-depth analysis detailing your home's value as well as a comparison with similar homes in the area
Home Values in the Area
Average Home Value in this Area
Purchase History
| Date | Buyer | Sale Price | Title Company |
|---|---|---|---|
| Lyman James H | -- | None Available | |
| Lyman James H | $1,200,000 | Lawyers Title Insurance Corp | |
| Townsend Raymond J | $996,000 | -- | |
| The Chicago Trust Company | $210,000 | -- |
Source: Public Records
Mortgage History
| Date | Status | Borrower | Loan Amount |
|---|---|---|---|
| Open | Lyman James H | $960,000 | |
| Previous Owner | Townsend Raymond J | $983,600 |
Source: Public Records
Tax History
| Year | Tax Paid | Tax Assessment Tax Assessment Total Assessment is a certain percentage of the fair market value that is determined by local assessors to be the total taxable value of land and additions on the property. | Land | Improvement |
|---|---|---|---|---|
| 2025 | $35,554 | $186,000 | $40,755 | $145,245 |
| 2024 | $35,554 | $160,000 | $34,485 | $125,515 |
| 2023 | $33,629 | $160,000 | $34,485 | $125,515 |
| 2022 | $33,629 | $160,000 | $34,485 | $125,515 |
| 2021 | $29,896 | $118,406 | $27,588 | $90,818 |
| 2020 | $29,466 | $118,406 | $27,588 | $90,818 |
| 2019 | $28,577 | $128,703 | $27,588 | $101,115 |
| 2018 | $28,965 | $125,186 | $23,826 | $101,360 |
| 2017 | $28,178 | $125,186 | $23,826 | $101,360 |
| 2016 | $27,689 | $129,883 | $23,826 | $106,057 |
| 2015 | $26,757 | $110,404 | $19,750 | $90,654 |
| 2014 | $26,344 | $110,404 | $19,750 | $90,654 |
| 2013 | -- | $110,404 | $19,750 | $90,654 |
Source: Public Records
Map
Nearby Homes
- 526 8th St
- 626 Washington Ave
- 526 Linden Ave
- 512 Central Ave
- 835 Forest Ave
- 420 Linden Ave Unit 502
- 412 Central Ave
- 922 Forest Ave
- 414 Laurel Ave
- 829 Elmwood Ave
- 611 Elmwood Ave
- 325 Central Ave
- 1119 Forest Ave
- 1209 Maple Ave
- 621 Green Bay Rd
- 925 Ashland Ave
- 1241 Maple Ave
- 2647 Poplar Ave
- 309 Driftwood Ln
- 2508 Isabella St
- 727 Central Ave
- 801 Central Ave
- 719 Central Ave
- 807 Central Ave
- 715 Central Ave
- 610 8th St
- 726 Greenleaf Ave
- 611 8th St
- 809 Central Ave
- 722 Greenleaf Ave
- 711 Central Ave
- 718 Greenleaf Ave
- 605 8th St
- 720 Central Ave
- 804 Central Ave
- 817 Central Ave
- 716 Central Ave
- 714 Greenleaf Ave
- 707 Central Ave
- 800 Greenleaf Ave
Your Personal Tour Guide
Ask me questions while you tour the home.