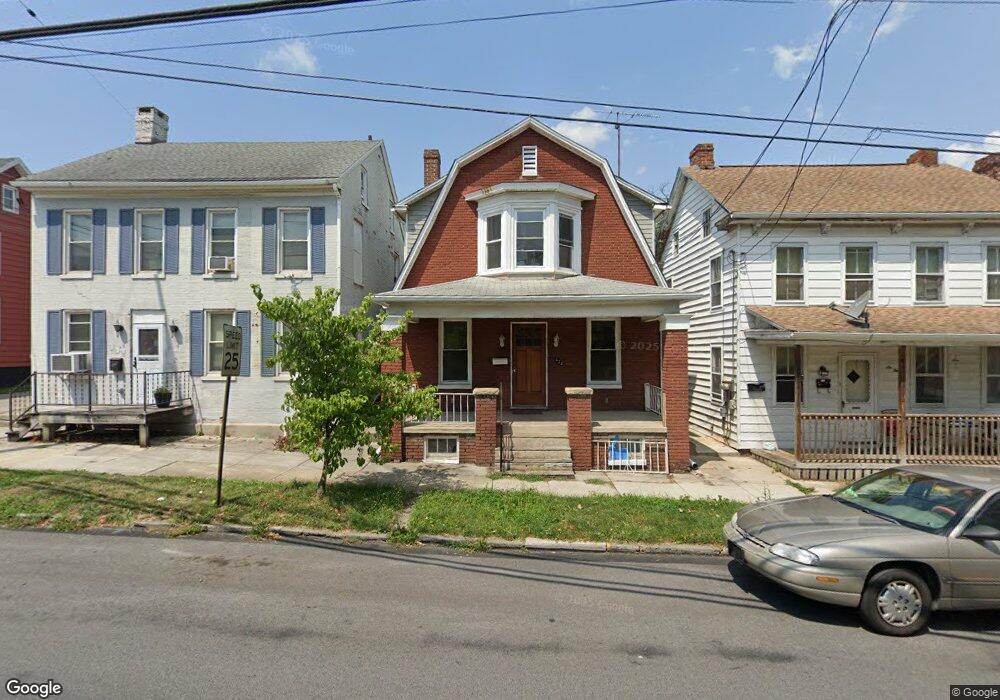
630 Broadway Hanover, PA 17331
Hanover Historic District NeighborhoodEstimated Value: $205,000 - $265,000
5
Beds
2
Baths
1,824
Sq Ft
$127/Sq Ft
Est. Value
About This Home
This home is located at 630 Broadway, Hanover, PA 17331 and is currently estimated at $231,449, approximately $126 per square foot. 630 Broadway is a home located in York County with nearby schools including Washington Elementary School, Clearview Elementary School, and Hanover Middle School.
Ownership History
Date
Name
Owned For
Owner Type
Purchase Details
Closed on
Nov 12, 2004
Sold by
Sarver James A and Sarver Sherry K
Bought by
Staub Joseph E and Staub Sandra J
Current Estimated Value
Home Financials for this Owner
Home Financials are based on the most recent Mortgage that was taken out on this home.
Original Mortgage
$99,000
Outstanding Balance
$49,470
Interest Rate
5.8%
Mortgage Type
Purchase Money Mortgage
Estimated Equity
$181,979
Purchase Details
Closed on
Jun 13, 1997
Bought by
M&S Associates
Create a Home Valuation Report for This Property
The Home Valuation Report is an in-depth analysis detailing your home's value as well as a comparison with similar homes in the area
Home Values in the Area
Average Home Value in this Area
Purchase History
| Date | Buyer | Sale Price | Title Company |
|---|---|---|---|
| Staub Joseph E | $110,000 | -- | |
| M&S Associates | $367,000 | -- |
Source: Public Records
Mortgage History
| Date | Status | Borrower | Loan Amount |
|---|---|---|---|
| Open | Staub Joseph E | $99,000 |
Source: Public Records
Tax History Compared to Growth
Tax History
| Year | Tax Paid | Tax Assessment Tax Assessment Total Assessment is a certain percentage of the fair market value that is determined by local assessors to be the total taxable value of land and additions on the property. | Land | Improvement |
|---|---|---|---|---|
| 2025 | $3,605 | $98,480 | $22,870 | $75,610 |
| 2024 | $3,578 | $98,480 | $22,870 | $75,610 |
| 2023 | $3,550 | $98,480 | $22,870 | $75,610 |
| 2022 | $3,507 | $98,480 | $22,870 | $75,610 |
| 2021 | $3,408 | $98,480 | $22,870 | $75,610 |
| 2020 | $3,408 | $98,480 | $22,870 | $75,610 |
| 2019 | $3,355 | $98,480 | $22,870 | $75,610 |
| 2018 | $3,293 | $98,480 | $22,870 | $75,610 |
| 2017 | $3,231 | $98,480 | $22,870 | $75,610 |
| 2016 | $0 | $98,480 | $22,870 | $75,610 |
| 2015 | -- | $98,480 | $22,870 | $75,610 |
| 2014 | -- | $98,480 | $22,870 | $75,610 |
Source: Public Records
Map
Nearby Homes