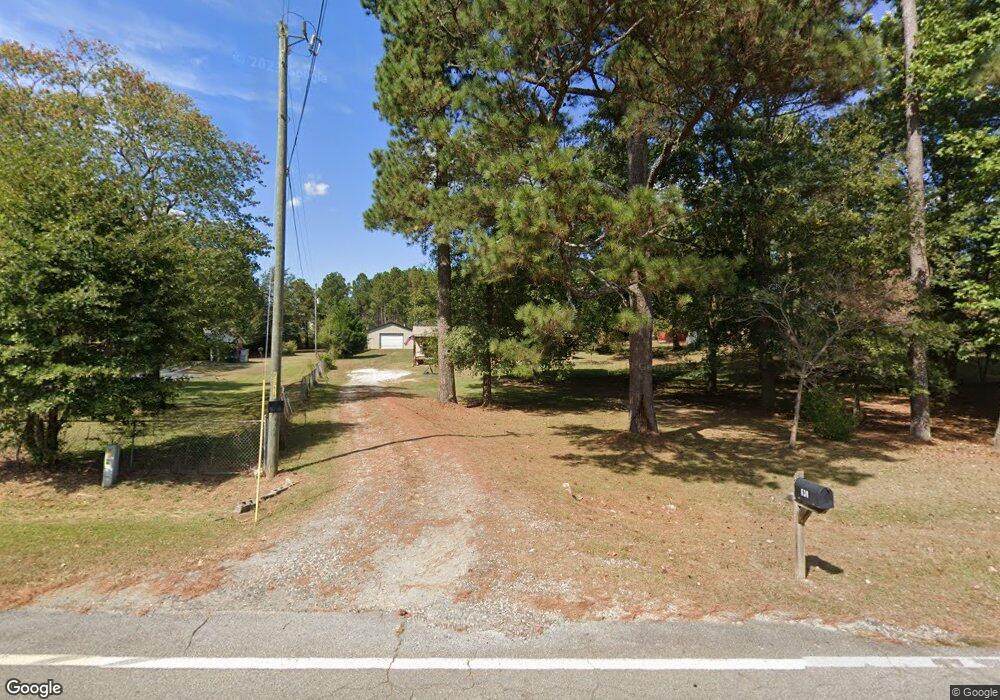
630 Chicken Lyle Rd Winder, GA 30680
Estimated Value: $240,000 - $314,000
3
Beds
1
Bath
1,575
Sq Ft
$180/Sq Ft
Est. Value
About This Home
This home is located at 630 Chicken Lyle Rd, Winder, GA 30680 and is currently estimated at $284,204, approximately $180 per square foot. 630 Chicken Lyle Rd is a home located in Barrow County with nearby schools including County Line Elementary School, Russell Middle School, and Winder-Barrow High School.
Ownership History
Date
Name
Owned For
Owner Type
Purchase Details
Closed on
Jul 29, 2022
Sold by
Adams Jeremy B
Bought by
Adams Jeremy and Weaver Alicia Michelle
Current Estimated Value
Home Financials for this Owner
Home Financials are based on the most recent Mortgage that was taken out on this home.
Original Mortgage
$127,500
Outstanding Balance
$121,918
Interest Rate
5.7%
Mortgage Type
New Conventional
Estimated Equity
$162,286
Purchase Details
Closed on
Jul 15, 2010
Sold by
Wells Johnny H
Bought by
Adams Jeremy B
Home Financials for this Owner
Home Financials are based on the most recent Mortgage that was taken out on this home.
Original Mortgage
$24,000
Interest Rate
8%
Mortgage Type
Trade
Purchase Details
Closed on
May 12, 2010
Sold by
Wells Jerry E
Bought by
Peppers Hugh M
Create a Home Valuation Report for This Property
The Home Valuation Report is an in-depth analysis detailing your home's value as well as a comparison with similar homes in the area
Home Values in the Area
Average Home Value in this Area
Purchase History
| Date | Buyer | Sale Price | Title Company |
|---|---|---|---|
| Adams Jeremy | -- | -- | |
| Adams Jeremy B | $19,000 | -- | |
| Adams Jeremy B | -- | -- | |
| Peppers Hugh M | -- | -- |
Source: Public Records
Mortgage History
| Date | Status | Borrower | Loan Amount |
|---|---|---|---|
| Open | Adams Jeremy | $127,500 | |
| Previous Owner | Adams Jeremy B | $24,000 |
Source: Public Records
Tax History Compared to Growth
Tax History
| Year | Tax Paid | Tax Assessment Tax Assessment Total Assessment is a certain percentage of the fair market value that is determined by local assessors to be the total taxable value of land and additions on the property. | Land | Improvement |
|---|---|---|---|---|
| 2024 | $1,829 | $76,720 | $18,000 | $58,720 |
| 2023 | $1,410 | $76,720 | $18,000 | $58,720 |
| 2022 | $1,216 | $44,983 | $11,200 | $33,783 |
| 2021 | $1,274 | $44,983 | $11,200 | $33,783 |
| 2020 | $1,274 | $44,983 | $11,200 | $33,783 |
| 2019 | $1,173 | $40,953 | $10,000 | $30,953 |
| 2018 | $936 | $33,816 | $10,000 | $23,816 |
| 2017 | $795 | $27,316 | $10,000 | $17,316 |
| 2016 | $711 | $27,316 | $10,000 | $17,316 |
| 2015 | $714 | $27,316 | $10,000 | $17,316 |
| 2014 | $550 | $22,216 | $4,900 | $17,316 |
| 2013 | -- | $22,216 | $4,900 | $17,316 |
Source: Public Records
Map
Nearby Homes
- 731 Lincoln Dr
- The Paisley Plan at Rockwell Farms
- The Rockwell Plan at Rockwell Farms
- The Barnes Plan at Rockwell Farms
- The Reynolds Plan at Rockwell Farms
- The Austin Plan at Rockwell Farms
- The Logan Plan at Rockwell Farms
- The Rose II Plan at Rockwell Farms
- 137 New Cut Rd
- 615 Wellington Dr
- 926 Live Oak Ct Unit 2
- 72 Mcmillian Ct
- 980 Lake Rockwell Way
- 412 Regan Dr
- 809 Custom Ln
- 746 Baskins Cir
- 290 Hyde Park
- 1686 Shadowstone Ct
- 300 Hyde Park
- 2858 Shadowstone Way
- 626 Chicken Lyle Rd
- 634 Chicken Lyle Rd
- 642 Chicken Lyle Rd
- 648 Chicken Lyle Rd
- 614 Chicken Lyle Rd
- 631 Chicken Lyle Rd
- 156 Woodruff Dr
- 617 Chicken Lyle Rd
- 647 Chicken Lyle Rd
- 105 Woodruff Dr
- 621 Chicken Lyle Rd
- 651 Chicken Lyle Rd
- 600 Chicken Lyle Rd
- 658 Chicken Lyle Rd
- 659 Chicken Lyle Rd
- 54 Pinehurst Dr
- 84 Pinehurst Dr
- 34 Pinehurst Dr
- 250 Greystone Ct
- 47 Avery Ct