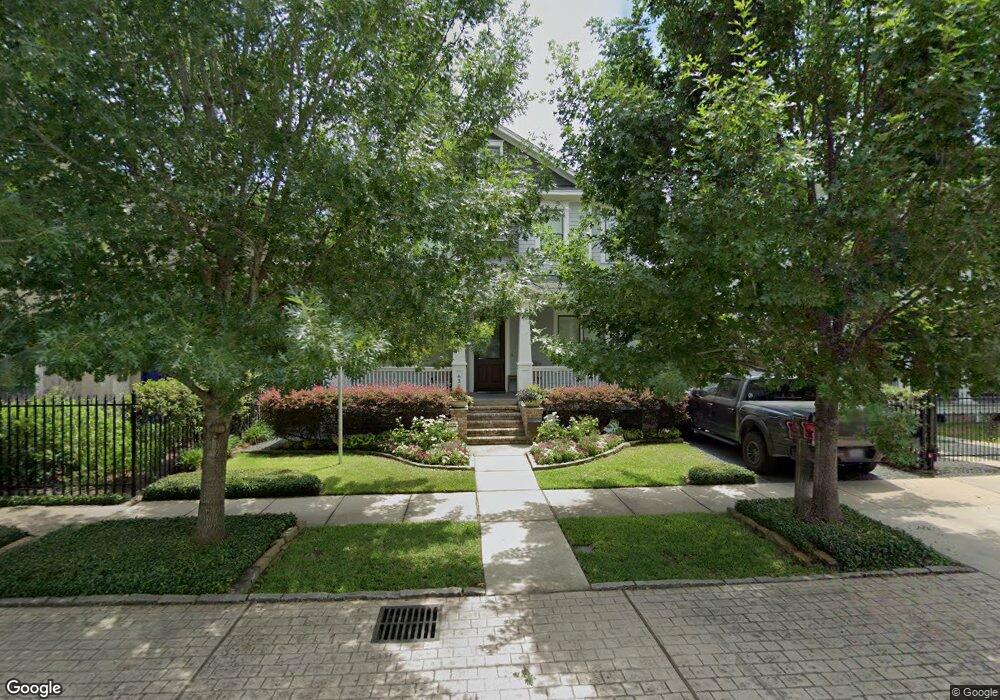
630 E 10th 1/2 St Houston, TX 77008
Greater Heights NeighborhoodEstimated Value: $1,625,000 - $1,913,000
4
Beds
4
Baths
3,553
Sq Ft
$489/Sq Ft
Est. Value
About This Home
This home is located at 630 E 10th 1/2 St, Houston, TX 77008 and is currently estimated at $1,737,811, approximately $489 per square foot. 630 E 10th 1/2 St is a home located in Harris County with nearby schools including Harvard Elementary School, Hogg Middle, and Heights High School.
Ownership History
Date
Name
Owned For
Owner Type
Purchase Details
Closed on
Jul 3, 2012
Sold by
Robert H Sanders Construction Inc
Bought by
Rim Ji Ryung
Current Estimated Value
Home Financials for this Owner
Home Financials are based on the most recent Mortgage that was taken out on this home.
Original Mortgage
$679,200
Outstanding Balance
$462,131
Interest Rate
3.37%
Mortgage Type
Adjustable Rate Mortgage/ARM
Estimated Equity
$1,275,680
Purchase Details
Closed on
Jul 14, 2005
Sold by
Hopkins James Edward
Bought by
Robert H Sanders Construction Inc
Home Financials for this Owner
Home Financials are based on the most recent Mortgage that was taken out on this home.
Original Mortgage
$160,000
Interest Rate
5.58%
Mortgage Type
Purchase Money Mortgage
Purchase Details
Closed on
Apr 28, 2005
Sold by
Martinez Carmen
Bought by
Hopkins James Edward
Create a Home Valuation Report for This Property
The Home Valuation Report is an in-depth analysis detailing your home's value as well as a comparison with similar homes in the area
Home Values in the Area
Average Home Value in this Area
Purchase History
| Date | Buyer | Sale Price | Title Company |
|---|---|---|---|
| Rim Ji Ryung | -- | None Available | |
| Robert H Sanders Construction Inc | -- | Fidelity National Title | |
| Hopkins James Edward | -- | Fidelity National Title |
Source: Public Records
Mortgage History
| Date | Status | Borrower | Loan Amount |
|---|---|---|---|
| Open | Rim Ji Ryung | $679,200 | |
| Previous Owner | Robert H Sanders Construction Inc | $160,000 |
Source: Public Records
Tax History
| Year | Tax Paid | Tax Assessment Tax Assessment Total Assessment is a certain percentage of the fair market value that is determined by local assessors to be the total taxable value of land and additions on the property. | Land | Improvement |
|---|---|---|---|---|
| 2025 | $24,595 | $1,603,742 | $562,500 | $1,041,242 |
| 2024 | $24,595 | $1,518,560 | $562,500 | $956,060 |
| 2023 | $24,595 | $1,619,868 | $562,500 | $1,057,368 |
| 2022 | $29,901 | $1,357,964 | $500,000 | $857,964 |
| 2021 | $29,878 | $1,316,309 | $500,000 | $816,309 |
| 2020 | $28,222 | $1,165,418 | $450,000 | $715,418 |
| 2019 | $27,878 | $1,101,701 | $450,000 | $651,701 |
| 2018 | $22,464 | $1,119,044 | $450,000 | $669,044 |
| 2017 | $28,296 | $1,119,044 | $450,000 | $669,044 |
| 2016 | $27,581 | $1,148,904 | $406,250 | $742,654 |
| 2015 | $18,456 | $1,149,653 | $343,750 | $805,903 |
| 2014 | $18,456 | $1,018,506 | $250,000 | $768,506 |
Source: Public Records
Map
Nearby Homes
- 1236 Omar St
- 1111 Studewood St Unit 503
- 729 E 9th St
- 1022 Arlington St
- 921 Arlington St
- 1121 Key St
- 1114 W Cottage St
- 1108 W Cottage St
- 1136 Woodland St
- 1100 Harvard St Unit 15
- 815 Arlington St
- 635 E 13th St
- 623 E 13th St
- 619 E 7th 1/2 St
- 3541 Michaux St
- 4008 Norhill Blvd
- 1011 W Cottage St
- 950 Omar St
- 1119 E 7th 1/2 St
- 943 Pecore St
- 636 E 10th 1/2 St
- 628 E 10th 1/2 St
- 640 E 10th 1 2 St
- 640 E 10th 1/2 St
- 633 E 10th St
- 635 E 10th St
- 629 E 10th St
- 644 E 10th 1/2 St
- 627 E 10th St
- 633 E 10th 1/2 St
- 627 E 10th 1/2 St
- 618 E 10th 1/2 St
- 625 E 10th St
- 629 E 10th 1/2 St
- 623 E 10th St
- 625 E 10th 1/2 St
- 635 E 10th 1/2 St
- 627 10th 1 2 St
- 614 E 10th 1/2 St
- 623 E 10 1 2 St
Your Personal Tour Guide
Ask me questions while you tour the home.