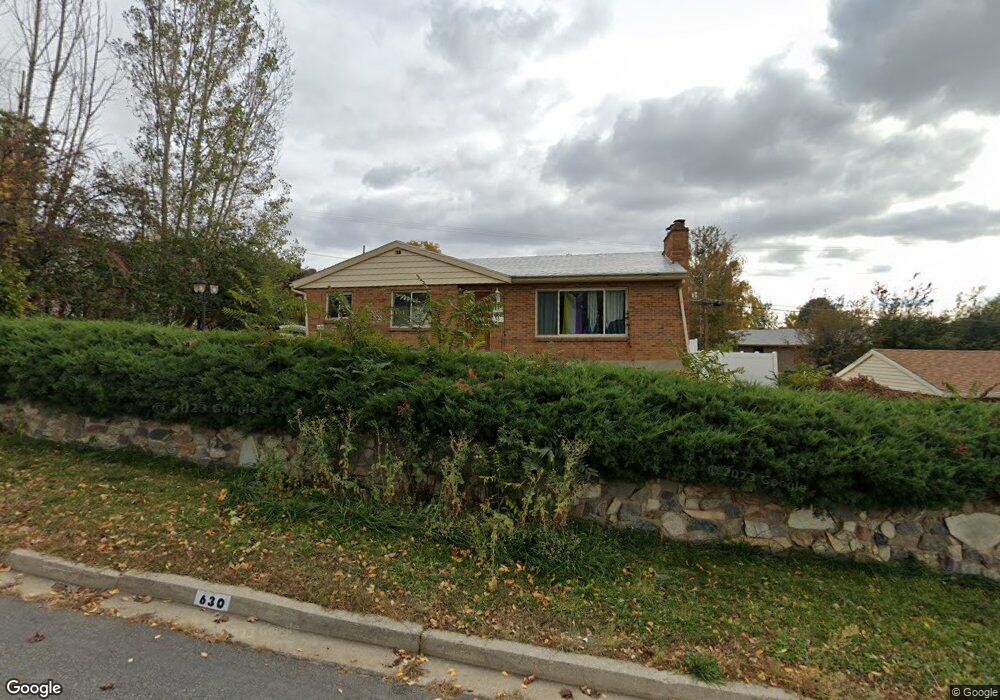
630 E 1130 N Bountiful, UT 84010
Estimated Value: $471,000 - $549,000
4
Beds
2
Baths
2,220
Sq Ft
$232/Sq Ft
Est. Value
About This Home
This home is located at 630 E 1130 N, Bountiful, UT 84010 and is currently estimated at $514,931, approximately $231 per square foot. 630 E 1130 N is a home located in Davis County with nearby schools including Tolman School, Bountiful Junior High School, and Viewmont High School.
Ownership History
Date
Name
Owned For
Owner Type
Purchase Details
Closed on
Oct 4, 2012
Sold by
Townsend Kevin D and Townsend Jane M
Bought by
Robinson Cara M
Current Estimated Value
Home Financials for this Owner
Home Financials are based on the most recent Mortgage that was taken out on this home.
Original Mortgage
$172,364
Outstanding Balance
$120,276
Interest Rate
3.75%
Mortgage Type
FHA
Estimated Equity
$394,655
Purchase Details
Closed on
Mar 25, 1999
Sold by
Raasch Sonnya J
Bought by
Townsend Kevin D and Townsend Jane M
Home Financials for this Owner
Home Financials are based on the most recent Mortgage that was taken out on this home.
Original Mortgage
$131,100
Interest Rate
6.73%
Purchase Details
Closed on
Apr 15, 1996
Sold by
Raasch Sonnja Jacklyn Staub
Bought by
Raasch John C and Raasch Sonnya J
Create a Home Valuation Report for This Property
The Home Valuation Report is an in-depth analysis detailing your home's value as well as a comparison with similar homes in the area
Purchase History
| Date | Buyer | Sale Price | Title Company |
|---|---|---|---|
| Robinson Cara M | -- | Cornerstone Title In | |
| Townsend Kevin D | -- | Western States Title Company | |
| Raasch John C | -- | -- |
Source: Public Records
Mortgage History
| Date | Status | Borrower | Loan Amount |
|---|---|---|---|
| Open | Robinson Cara M | $172,364 | |
| Previous Owner | Townsend Kevin D | $131,100 |
Source: Public Records
Tax History
| Year | Tax Paid | Tax Assessment Tax Assessment Total Assessment is a certain percentage of the fair market value that is determined by local assessors to be the total taxable value of land and additions on the property. | Land | Improvement |
|---|---|---|---|---|
| 2025 | $2,729 | $247,500 | $119,204 | $128,296 |
| 2024 | $2,566 | $242,000 | $110,120 | $131,880 |
| 2023 | $2,611 | $423,000 | $196,885 | $226,115 |
| 2022 | $2,665 | $245,850 | $104,455 | $141,395 |
| 2021 | $2,306 | $318,000 | $155,016 | $162,984 |
| 2020 | $1,959 | $281,000 | $141,212 | $139,788 |
| 2019 | $1,989 | $279,000 | $145,356 | $133,644 |
| 2018 | $1,850 | $255,000 | $134,161 | $120,839 |
| 2016 | $1,612 | $120,396 | $40,171 | $80,225 |
| 2015 | $1,621 | $114,510 | $40,815 | $73,695 |
| 2014 | $1,588 | $115,428 | $40,815 | $74,613 |
| 2013 | -- | $113,050 | $42,890 | $70,160 |
Source: Public Records
Map
Nearby Homes
- 513 N 400 E Unit 14B
- 214 E 1250 N
- 978 N 170 E
- 908 Northern Hills Dr Unit 3
- 453 N 400 E Unit 7-D
- 933 Northern Hills Cir
- 683 E 100 N
- 129 N 800 E
- 1420 N Main St
- 6 N 800 E
- 967 S Courtyard Ln
- 17 E 400 N Unit 19B
- 207 E 820 S
- 610 S 800 E
- 150 E 735 S Unit 23
- 49 E 200 N Unit 4
- 41 E 200 N Unit 6
- 55 E 200 N Unit 2
- 51 E 200 N Unit 3
- 256 N Main St
Your Personal Tour Guide
Ask me questions while you tour the home.