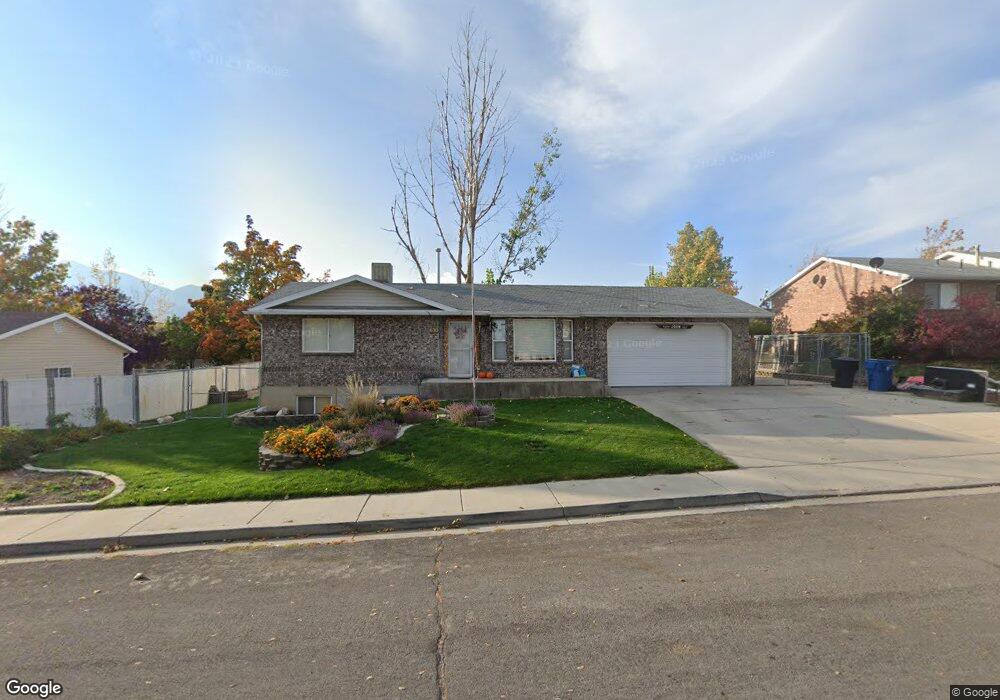
630 E 500 N Payson, UT 84651
Estimated Value: $436,000 - $460,000
3
Beds
2
Baths
1,040
Sq Ft
$427/Sq Ft
Est. Value
About This Home
This home is located at 630 E 500 N, Payson, UT 84651 and is currently estimated at $444,506, approximately $427 per square foot. 630 E 500 N is a home located in Utah County with nearby schools including Barnett Elementary School, Salem Junior High School, and Valley View Middle School.
Ownership History
Date
Name
Owned For
Owner Type
Purchase Details
Closed on
Jan 22, 2021
Sold by
John Kenny
Bought by
John Kenny L and John Julie W
Current Estimated Value
Home Financials for this Owner
Home Financials are based on the most recent Mortgage that was taken out on this home.
Original Mortgage
$220,800
Interest Rate
2.67%
Mortgage Type
New Conventional
Purchase Details
Closed on
Oct 25, 2019
Sold by
John Kenny and John Kenny L
Bought by
John Kenny L and John Julie W
Home Financials for this Owner
Home Financials are based on the most recent Mortgage that was taken out on this home.
Original Mortgage
$223,500
Interest Rate
3.7%
Mortgage Type
New Conventional
Purchase Details
Closed on
Nov 2, 2018
Sold by
John Kenny L
Bought by
John Kenny L and John Julie W
Home Financials for this Owner
Home Financials are based on the most recent Mortgage that was taken out on this home.
Original Mortgage
$188,000
Interest Rate
4.7%
Mortgage Type
New Conventional
Purchase Details
Closed on
Sep 11, 2015
Sold by
John Kenny L
Bought by
John Kenny L and John Julie W
Create a Home Valuation Report for This Property
The Home Valuation Report is an in-depth analysis detailing your home's value as well as a comparison with similar homes in the area
Home Values in the Area
Average Home Value in this Area
Purchase History
We collect this data history from publicly available records. To have your information removed, we recommend requesting removal directly through your county’s website.
| Date | Buyer | Sale Price | Title Company |
|---|---|---|---|
| John Kenny L | -- | Lydolph & Weierholt Ttl Ins | |
| John Kenny | -- | Lydolph & Weierholt Ttl Ins | |
| John Kenny L | -- | Accommodation | |
| John Kenny | -- | Accommodation | |
| John Kenny L | -- | Utah First Title Ins Agcy | |
| John Kenny L | -- | Utah First Title Ins Agcy | |
| John Kenny L | -- | Inwest Title | |
| John Kenny L | -- | Inwest Title |
Source: Public Records
Mortgage History
We collect this data history from publicly available records. To have your information removed, we recommend requesting removal directly through your county’s website.
| Date | Status | Borrower | Loan Amount |
|---|---|---|---|
| Closed | John Kenny | $220,800 | |
| Closed | John Kenny | $223,500 | |
| Closed | John Kenny L | $188,000 |
Source: Public Records
Tax History
| Year | Tax Paid | Tax Assessment Tax Assessment Total Assessment is a certain percentage of the fair market value that is determined by local assessors to be the total taxable value of land and additions on the property. | Land | Improvement |
|---|---|---|---|---|
| 2025 | $2,047 | $228,305 | -- | -- |
| 2024 | $2,047 | $208,285 | $0 | $0 |
| 2023 | $2,052 | $209,440 | $0 | $0 |
| 2022 | $2,051 | $205,865 | $0 | $0 |
| 2021 | $1,744 | $280,800 | $86,400 | $194,400 |
| 2020 | $1,654 | $260,500 | $78,500 | $182,000 |
| 2019 | $1,524 | $246,100 | $70,300 | $175,800 |
| 2018 | $1,399 | $217,700 | $62,800 | $154,900 |
| 2017 | $1,321 | $110,550 | $0 | $0 |
| 2016 | $1,230 | $102,300 | $0 | $0 |
| 2015 | $1,140 | $94,160 | $0 | $0 |
| 2014 | $1,012 | $84,150 | $0 | $0 |
Source: Public Records
Map
Nearby Homes
Your Personal Tour Guide
Ask me questions while you tour the home.