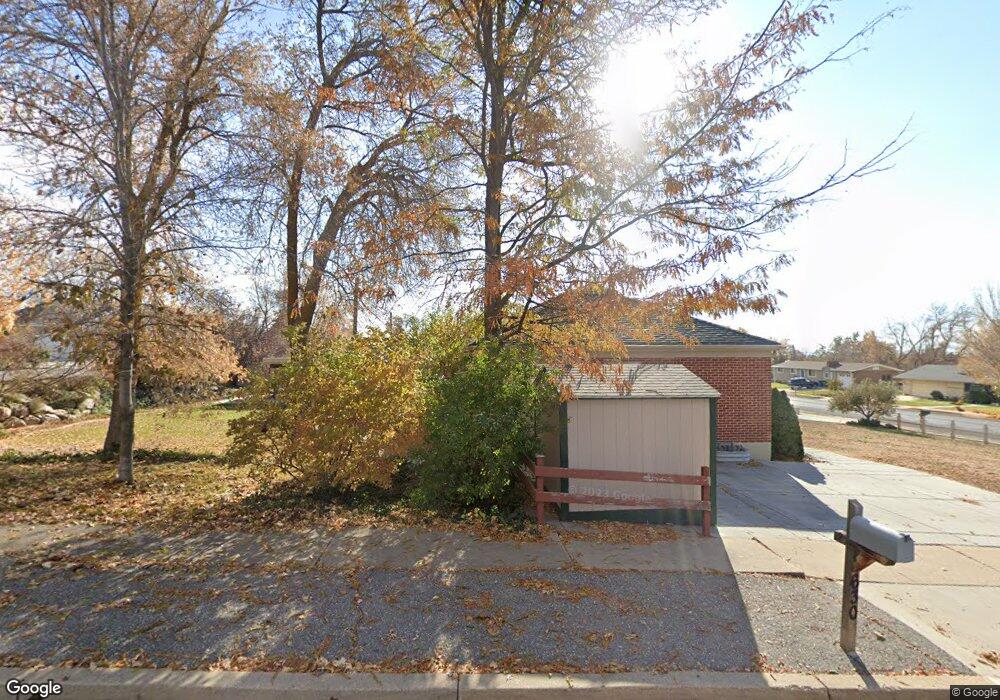
630 E Center St Kaysville, UT 84037
Estimated Value: $607,516 - $722,000
4
Beds
3
Baths
2,903
Sq Ft
$223/Sq Ft
Est. Value
About This Home
This home is located at 630 E Center St, Kaysville, UT 84037 and is currently estimated at $647,629, approximately $223 per square foot. 630 E Center St is a home located in Davis County with nearby schools including H.C. Burton Elementary School, Kaysville Junior High School, and Davis High School.
Ownership History
Date
Name
Owned For
Owner Type
Purchase Details
Closed on
May 7, 2025
Sold by
Hawk Homes and Flint Investments Llc
Bought by
Flint Investments Llc
Current Estimated Value
Purchase Details
Closed on
May 1, 2025
Sold by
Hatch Burke
Bought by
Hawk Homes and Flint Investments Llc
Purchase Details
Closed on
May 4, 2020
Sold by
Dennis Douglas R and Dennis Marcia J
Bought by
Hatch Burke
Home Financials for this Owner
Home Financials are based on the most recent Mortgage that was taken out on this home.
Original Mortgage
$325,550
Interest Rate
3.5%
Mortgage Type
New Conventional
Purchase Details
Closed on
Jun 27, 2007
Sold by
Capener Terry L and Capener Lori
Bought by
Dennis Douglas R and Dennis Marcia J
Home Financials for this Owner
Home Financials are based on the most recent Mortgage that was taken out on this home.
Original Mortgage
$130,000
Interest Rate
5.9%
Mortgage Type
Purchase Money Mortgage
Create a Home Valuation Report for This Property
The Home Valuation Report is an in-depth analysis detailing your home's value as well as a comparison with similar homes in the area
Home Values in the Area
Average Home Value in this Area
Purchase History
| Date | Buyer | Sale Price | Title Company |
|---|---|---|---|
| Flint Investments Llc | -- | None Listed On Document | |
| Hawk Homes | -- | None Listed On Document | |
| Hawk Homes | -- | None Listed On Document | |
| Hatch Burke | -- | Mountain View Title And E | |
| Dennis Douglas R | -- | Mountain View Title & Escrow |
Source: Public Records
Mortgage History
| Date | Status | Borrower | Loan Amount |
|---|---|---|---|
| Previous Owner | Hatch Burke | $325,550 | |
| Previous Owner | Dennis Douglas R | $130,000 |
Source: Public Records
Tax History
| Year | Tax Paid | Tax Assessment Tax Assessment Total Assessment is a certain percentage of the fair market value that is determined by local assessors to be the total taxable value of land and additions on the property. | Land | Improvement |
|---|---|---|---|---|
| 2025 | $2,980 | $309,650 | $212,787 | $96,863 |
| 2024 | $2,853 | $300,849 | $164,663 | $136,186 |
| 2023 | $2,844 | $292,050 | $163,364 | $128,685 |
| 2022 | $2,893 | $551,000 | $290,606 | $260,394 |
| 2021 | $2,713 | $426,000 | $214,768 | $211,232 |
| 2020 | $2,237 | $342,000 | $187,934 | $154,066 |
| 2019 | $2,158 | $324,000 | $197,416 | $126,584 |
| 2018 | $1,984 | $297,000 | $175,699 | $121,301 |
| 2016 | $210 | $140,470 | $50,112 | $90,358 |
| 2015 | $1,748 | $130,570 | $50,112 | $80,458 |
| 2014 | $721 | $146,136 | $50,440 | $95,696 |
| 2013 | -- | $115,645 | $30,777 | $84,868 |
Source: Public Records
Map
Nearby Homes
- 1236 E 100 S
- 358 S 850 E
- 270 N 900 E
- 637 Cherrywood Rd
- 1015 Brook Haven Dr
- 56 Whitaker Cir
- 425 E 500 N
- 97 E Crestwood Rd
- 285 E 500 N Unit 102
- 42 W Center St
- 481 N 150 E
- 400 N 30 E
- 473 Hampton Ct
- 1351 E Baer Canyon Rd
- 882 S Daisy Dr
- 777 E Apple Blossom Way
- 150 E 600 N Unit 5
- 150 E 600 N Unit 18
- 125 W 525 N
- 1730 250 N Unit 23-R
Your Personal Tour Guide
Ask me questions while you tour the home.