3
Beds
2
Baths
1,536
Sq Ft
22,216
Sq Ft Lot
About This Home
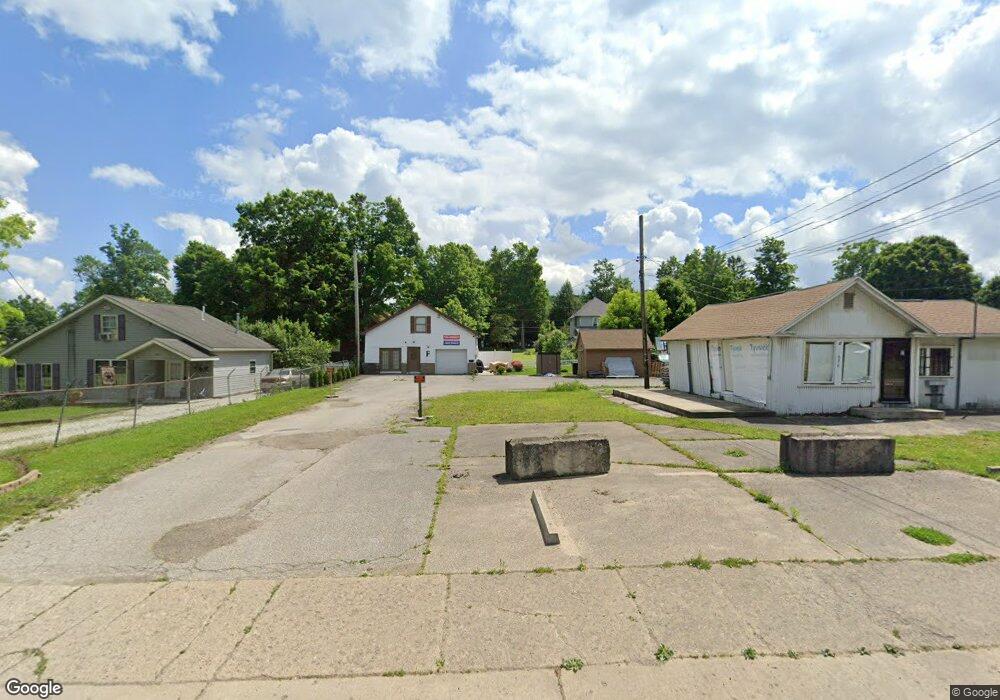
This home is located at 630 E Main St, Corry, PA 16407. 630 E Main St is a home located in Erie County with nearby schools including Corry Area Primary School, Corry Area Intermediate School, and Corry Area Middle School.
Ownership History
Date
Name
Owned For
Owner Type
Purchase Details
Closed on
Sep 15, 2011
Sold by
Northwest Savings Bank
Bought by
Webber Clayton E and Webber Susan E
Purchase Details
Closed on
Jul 19, 2007
Sold by
Catalfu Patrick J and Catalfu Sherry L
Bought by
Catalfu Philip J and Catalfu Diane M
Home Financials for this Owner
Home Financials are based on the most recent Mortgage that was taken out on this home.
Original Mortgage
$300,000
Interest Rate
6.54%
Mortgage Type
Commercial
Purchase Details
Closed on
Dec 27, 2006
Sold by
Webber Clayton E and Webber Susan E
Bought by
Catalfu Philip J and Catalfu Diane M
Home Financials for this Owner
Home Financials are based on the most recent Mortgage that was taken out on this home.
Original Mortgage
$300,000
Interest Rate
6.29%
Mortgage Type
Commercial
Create a Home Valuation Report for This Property
The Home Valuation Report is an in-depth analysis detailing your home's value as well as a comparison with similar homes in the area
Home Values in the Area
Average Home Value in this Area
Purchase History
| Date | Buyer | Sale Price | Title Company |
|---|---|---|---|
| Webber Clayton E | $60,000 | None Available | |
| Catalfu Philip J | -- | None Available | |
| Catalfu Philip J | $147,000 | None Available |
Source: Public Records
Mortgage History
| Date | Status | Borrower | Loan Amount |
|---|---|---|---|
| Previous Owner | Catalfu Philip J | $300,000 | |
| Previous Owner | Catalfu Philip J | $300,000 |
Source: Public Records
Tax History
| Year | Tax Paid | Tax Assessment Tax Assessment Total Assessment is a certain percentage of the fair market value that is determined by local assessors to be the total taxable value of land and additions on the property. | Land | Improvement |
|---|---|---|---|---|
| 2025 | $2,289 | $70,000 | $20,000 | $50,000 |
| 2024 | $2,274 | $70,000 | $20,000 | $50,000 |
| 2023 | $2,218 | $70,000 | $20,000 | $50,000 |
| 2022 | $2,176 | $70,000 | $20,000 | $50,000 |
| 2021 | $2,161 | $70,000 | $20,000 | $50,000 |
| 2020 | $2,143 | $70,000 | $20,000 | $50,000 |
| 2019 | $2,109 | $70,000 | $20,000 | $50,000 |
| 2018 | $2,081 | $70,000 | $20,000 | $50,000 |
| 2017 | $3,342 | $114,400 | $22,000 | $92,400 |
| 2016 | $3,605 | $114,400 | $22,000 | $92,400 |
| 2015 | $3,576 | $114,400 | $22,000 | $92,400 |
| 2014 | $1,547 | $114,400 | $22,000 | $92,400 |
Source: Public Records
Map
Nearby Homes
- 219 Summer St
- 604 E South St Unit 2
- 533 E South St
- 433 E Pleasant St
- 425 E Pleasant St
- 515 Catherine St
- 46375 6th St
- 535 Wright St
- 35 W Smith St
- 27 W Frederick St
- 671 E Columbus Ave
- 110-118 W Smith and 307 Grace St
- 132 Random Rd
- 820 Mead Ave
- 837 Us Highway 6
- 1026 N Center St
- 40 Marion St
- 503 W Washington St
- 318 Worth St
- 538 Grand St
Your Personal Tour Guide
Ask me questions while you tour the home.