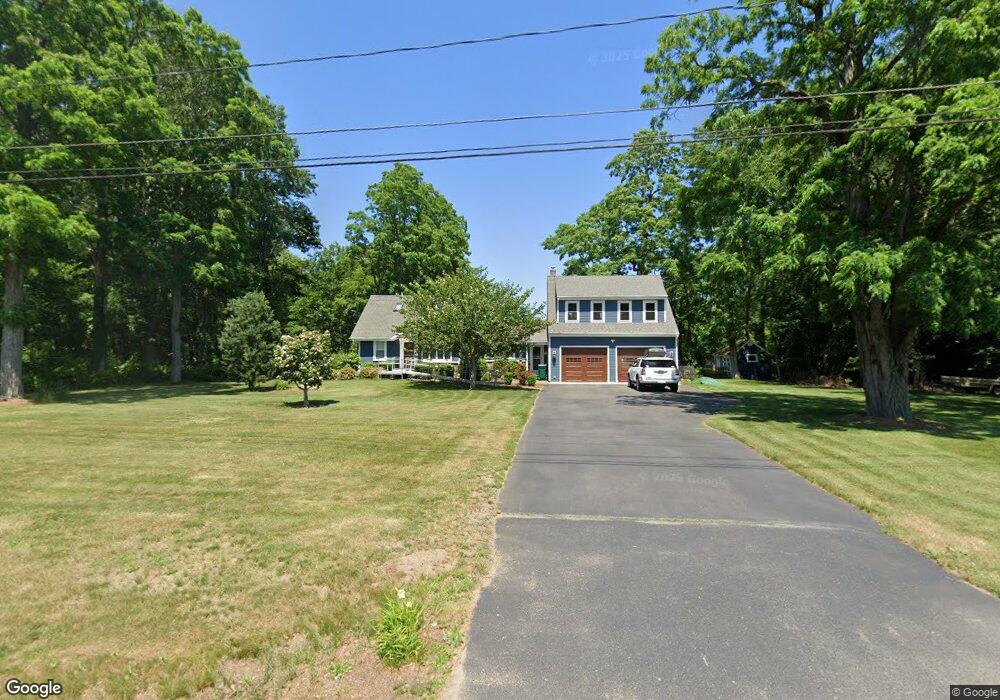
630 Elm St E Raynham, MA 02767
Estimated Value: $600,000 - $694,000
3
Beds
2
Baths
1,544
Sq Ft
$419/Sq Ft
Est. Value
About This Home
This home is located at 630 Elm St E, Raynham, MA 02767 and is currently estimated at $647,493, approximately $419 per square foot. 630 Elm St E is a home located in Bristol County with nearby schools including Merrill Elementary School, LaLiberte Elementary School, and Williams Intermediate School.
Ownership History
Date
Name
Owned For
Owner Type
Purchase Details
Closed on
Jul 17, 2018
Sold by
Carlson Richard R
Bought by
147 Prospect Street T
Current Estimated Value
Purchase Details
Closed on
Apr 14, 2005
Sold by
Laro Ronald A and Laro Raymond E
Bought by
Terrasi Bruno F
Home Financials for this Owner
Home Financials are based on the most recent Mortgage that was taken out on this home.
Original Mortgage
$28,700
Interest Rate
5.78%
Mortgage Type
Purchase Money Mortgage
Create a Home Valuation Report for This Property
The Home Valuation Report is an in-depth analysis detailing your home's value as well as a comparison with similar homes in the area
Home Values in the Area
Average Home Value in this Area
Purchase History
| Date | Buyer | Sale Price | Title Company |
|---|---|---|---|
| 147 Prospect Street T | $361,000 | -- | |
| Terrasi Bruno F | $288,000 | -- |
Source: Public Records
Mortgage History
| Date | Status | Borrower | Loan Amount |
|---|---|---|---|
| Previous Owner | Terrasi Bruno F | $28,700 |
Source: Public Records
Tax History
| Year | Tax Paid | Tax Assessment Tax Assessment Total Assessment is a certain percentage of the fair market value that is determined by local assessors to be the total taxable value of land and additions on the property. | Land | Improvement |
|---|---|---|---|---|
| 2025 | $6,394 | $528,400 | $192,900 | $335,500 |
| 2024 | $6,112 | $492,100 | $173,600 | $318,500 |
| 2023 | $5,787 | $425,500 | $163,900 | $261,600 |
| 2022 | $5,675 | $382,700 | $154,300 | $228,400 |
| 2021 | $5,222 | $355,500 | $135,000 | $220,500 |
| 2020 | $4,154 | $288,300 | $127,300 | $161,000 |
| 2019 | $3,893 | $273,600 | $119,600 | $154,000 |
| 2018 | $3,631 | $243,700 | $106,100 | $137,600 |
| 2017 | $3,416 | $227,300 | $100,300 | $127,000 |
| 2016 | $3,347 | $223,400 | $96,400 | $127,000 |
| 2015 | $3,330 | $218,500 | $99,600 | $118,900 |
Source: Public Records
Map
Nearby Homes
- 29 Saddle Dr
- 658 Broadway
- 1540 Broadway Unit 35
- 000 Old Pleasant St
- 84 Diniz Dr
- 32 Laurel Ln
- 36 Stony Brook Rd
- 123 Center St
- 2 Maplewood Ln Unit 21-1
- 0 Maplewood Unit 21.3 73426136
- 138 Carver St
- 54 Wilbur St
- 1359 Old Pleasant St
- 35 Sophia Ln
- 173 Titicut Rd
- 646 Broadway
- 634 Broadway
- 300 Prospect Hill St
- 110 Cobblestone Ln
- 40 Country Club Dr
Your Personal Tour Guide
Ask me questions while you tour the home.