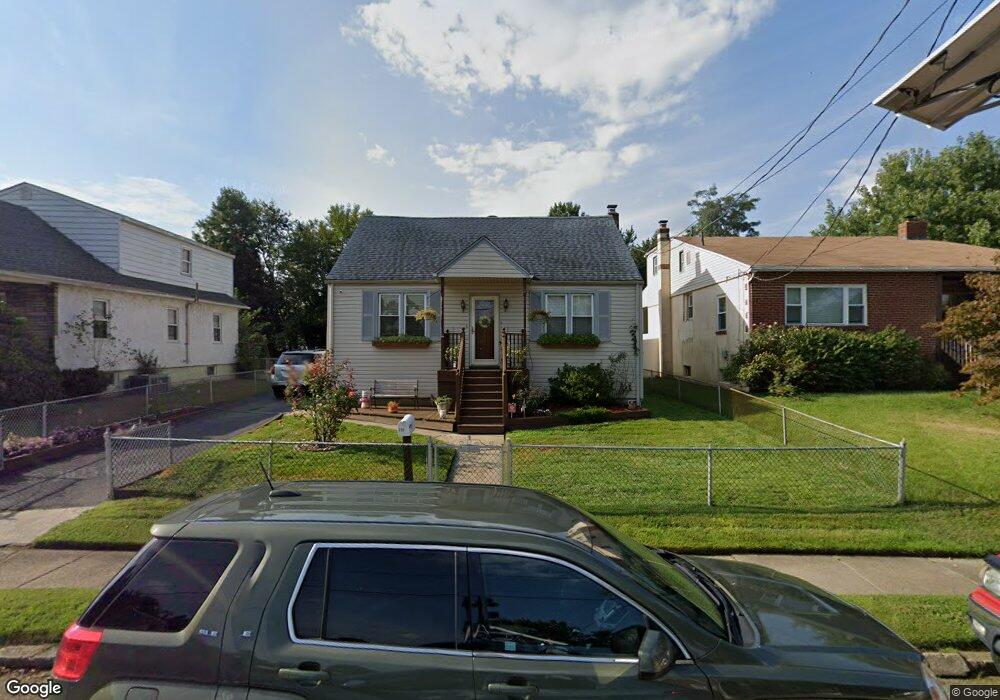
630 Green Ave Mount Ephraim, NJ 08059
Estimated Value: $234,228 - $292,000
--
Bed
--
Bath
1,170
Sq Ft
$230/Sq Ft
Est. Value
About This Home
This home is located at 630 Green Ave, Mount Ephraim, NJ 08059 and is currently estimated at $268,557, approximately $229 per square foot. 630 Green Ave is a home located in Camden County with nearby schools including Mary Bray Elementary School and Raymond W. Kershaw Elementary School.
Ownership History
Date
Name
Owned For
Owner Type
Purchase Details
Closed on
Apr 12, 2022
Sold by
Hoffman John R
Bought by
Hoffman Coleen
Current Estimated Value
Purchase Details
Closed on
Jul 30, 1993
Sold by
Mcgee Brian K
Bought by
Hoffman John R and Tricocci Coleen
Home Financials for this Owner
Home Financials are based on the most recent Mortgage that was taken out on this home.
Original Mortgage
$92,000
Interest Rate
7.1%
Mortgage Type
FHA
Create a Home Valuation Report for This Property
The Home Valuation Report is an in-depth analysis detailing your home's value as well as a comparison with similar homes in the area
Home Values in the Area
Average Home Value in this Area
Purchase History
| Date | Buyer | Sale Price | Title Company |
|---|---|---|---|
| Hoffman Coleen | -- | -- | |
| Hoffman Coleen | -- | None Listed On Document | |
| Hoffman John R | $92,000 | -- | |
| Hoffman John R | $92,000 | -- |
Source: Public Records
Mortgage History
| Date | Status | Borrower | Loan Amount |
|---|---|---|---|
| Previous Owner | Hoffman John R | $92,000 |
Source: Public Records
Tax History Compared to Growth
Tax History
| Year | Tax Paid | Tax Assessment Tax Assessment Total Assessment is a certain percentage of the fair market value that is determined by local assessors to be the total taxable value of land and additions on the property. | Land | Improvement |
|---|---|---|---|---|
| 2025 | $7,231 | $138,400 | $40,000 | $98,400 |
| 2024 | $7,136 | $138,400 | $40,000 | $98,400 |
| 2023 | $7,136 | $138,400 | $40,000 | $98,400 |
| 2022 | $6,944 | $138,400 | $40,000 | $98,400 |
| 2021 | $6,750 | $138,400 | $40,000 | $98,400 |
| 2020 | $6,567 | $138,400 | $40,000 | $98,400 |
| 2019 | $6,448 | $138,400 | $40,000 | $98,400 |
| 2018 | $6,391 | $138,400 | $40,000 | $98,400 |
| 2017 | $6,297 | $138,400 | $40,000 | $98,400 |
| 2016 | $6,099 | $138,400 | $40,000 | $98,400 |
| 2015 | $5,889 | $138,400 | $40,000 | $98,400 |
| 2014 | $5,981 | $88,700 | $26,300 | $62,400 |
Source: Public Records
Map
Nearby Homes