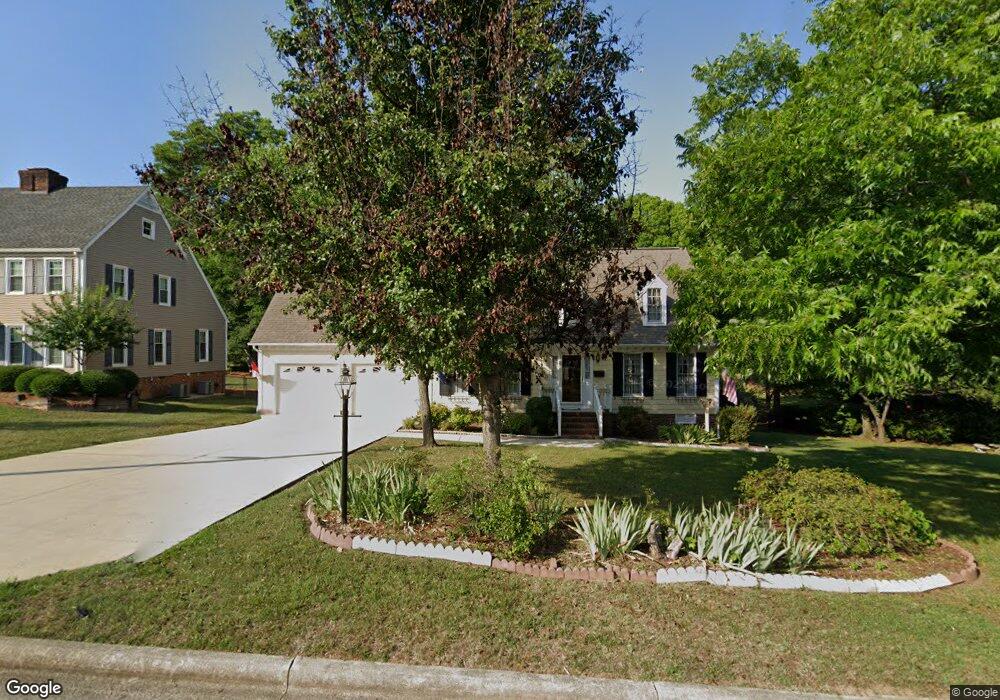
630 Johnson Ave Graham, NC 27253
Estimated Value: $278,000 - $344,000
3
Beds
2
Baths
1,804
Sq Ft
$176/Sq Ft
Est. Value
About This Home
This home is located at 630 Johnson Ave, Graham, NC 27253 and is currently estimated at $317,348, approximately $175 per square foot. 630 Johnson Ave is a home located in Alamance County with nearby schools including South Graham Elementary School, Graham Middle School, and Graham High School.
Create a Home Valuation Report for This Property
The Home Valuation Report is an in-depth analysis detailing your home's value as well as a comparison with similar homes in the area
Home Values in the Area
Average Home Value in this Area
Tax History Compared to Growth
Tax History
| Year | Tax Paid | Tax Assessment Tax Assessment Total Assessment is a certain percentage of the fair market value that is determined by local assessors to be the total taxable value of land and additions on the property. | Land | Improvement |
|---|---|---|---|---|
| 2025 | $1,638 | $331,497 | $31,500 | $299,997 |
| 2024 | $1,555 | $331,497 | $31,500 | $299,997 |
| 2023 | $1,425 | $331,497 | $31,500 | $299,997 |
| 2022 | $1,785 | $162,004 | $30,000 | $132,004 |
| 2021 | $1,800 | $162,004 | $30,000 | $132,004 |
| 2020 | $1,817 | $162,004 | $30,000 | $132,004 |
| 2019 | $1,823 | $162,004 | $30,000 | $132,004 |
| 2018 | $0 | $162,004 | $30,000 | $132,004 |
| 2017 | $1,677 | $162,004 | $30,000 | $132,004 |
| 2016 | $1,769 | $170,913 | $30,000 | $140,913 |
| 2015 | $986 | $170,913 | $30,000 | $140,913 |
| 2014 | $901 | $170,913 | $30,000 | $140,913 |
Source: Public Records
Map
Nearby Homes
- 615 Paris St
- 717 Brookgreen Terrace
- 304 Field St
- 311 E McAden St
- 623 Oakgrove Dr
- 600 Townbranch Rd
- 417 Ashburn St
- 1321 Adler Cove Rd
- 1311 Adler Cove Rd
- 529 Carter Rd
- 517 Carter Rd
- 0 Wade St Unit 1145043
- 306 Eastway Ln
- 28 Longdale Dr
- 504 Mendel Terrace
- Plan 2074 at Graham Springs
- Plan 2723 at Graham Springs
- Plan 1288 at Graham Springs
- Plan 2539 Modeled at Graham Springs
- Plan 2338 at Graham Springs