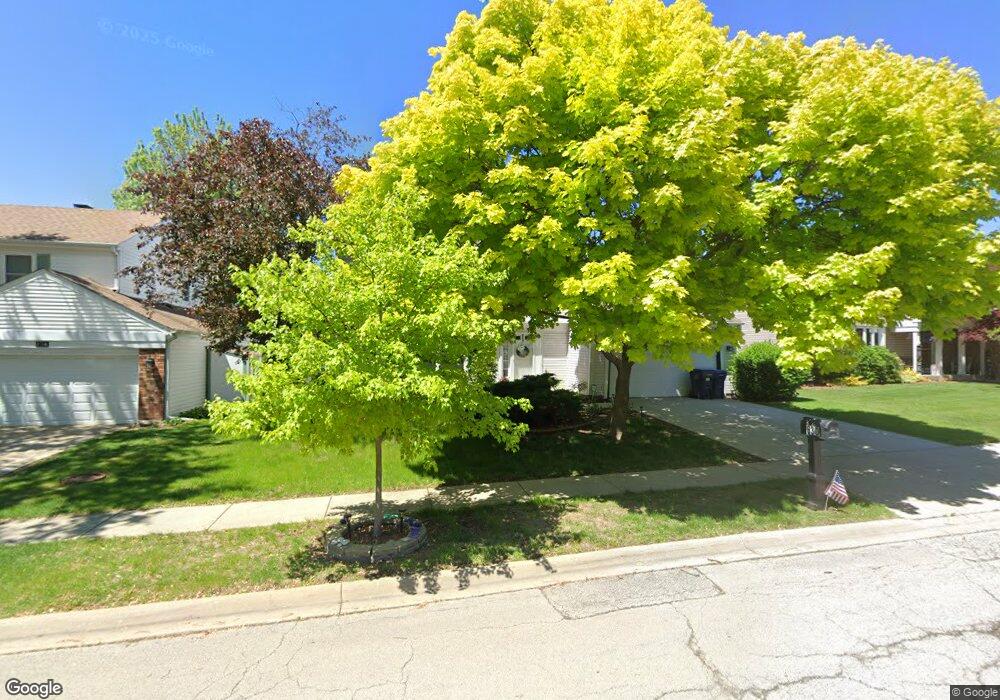
630 Linsey Ave Schaumburg, IL 60194
West Schaumburg NeighborhoodEstimated Value: $446,788 - $504,000
3
Beds
2
Baths
1,774
Sq Ft
$268/Sq Ft
Est. Value
About This Home
This home is located at 630 Linsey Ave, Schaumburg, IL 60194 and is currently estimated at $475,447, approximately $268 per square foot. 630 Linsey Ave is a home located in Cook County with nearby schools including Elizabeth Blackwell Elementary School, Jane Addams Junior High School, and Schaumburg High School.
Ownership History
Date
Name
Owned For
Owner Type
Purchase Details
Closed on
Nov 17, 2017
Sold by
Rao Sundar Krishna and Rao Saroja
Bought by
Schmidt Christina V and Schmidt Michael E
Current Estimated Value
Home Financials for this Owner
Home Financials are based on the most recent Mortgage that was taken out on this home.
Original Mortgage
$280,623
Outstanding Balance
$234,525
Interest Rate
3.75%
Mortgage Type
FHA
Estimated Equity
$240,922
Purchase Details
Closed on
Mar 30, 2012
Sold by
Madhavrao Sundar K and Madhavarao Saroja
Bought by
Rao Sundar Krishna and Rao Saroja
Home Financials for this Owner
Home Financials are based on the most recent Mortgage that was taken out on this home.
Original Mortgage
$140,234
Interest Rate
3.92%
Mortgage Type
New Conventional
Purchase Details
Closed on
Sep 25, 1998
Sold by
Kopin Gayle and Diamond Gayle
Bought by
Madhavarao Sundar K and Madhavarao Saroja
Home Financials for this Owner
Home Financials are based on the most recent Mortgage that was taken out on this home.
Original Mortgage
$164,350
Interest Rate
6.97%
Create a Home Valuation Report for This Property
The Home Valuation Report is an in-depth analysis detailing your home's value as well as a comparison with similar homes in the area
Home Values in the Area
Average Home Value in this Area
Purchase History
| Date | Buyer | Sale Price | Title Company |
|---|---|---|---|
| Schmidt Christina V | $286,000 | Attorney | |
| Rao Sundar Krishna | -- | Tek Title Llc | |
| Madhavarao Sundar K | $173,000 | Rei Title Services |
Source: Public Records
Mortgage History
| Date | Status | Borrower | Loan Amount |
|---|---|---|---|
| Open | Schmidt Christina V | $280,623 | |
| Previous Owner | Rao Sundar Krishna | $140,234 | |
| Previous Owner | Madhavarao Sundar K | $164,350 |
Source: Public Records
Tax History Compared to Growth
Tax History
| Year | Tax Paid | Tax Assessment Tax Assessment Total Assessment is a certain percentage of the fair market value that is determined by local assessors to be the total taxable value of land and additions on the property. | Land | Improvement |
|---|---|---|---|---|
| 2024 | $9,244 | $31,543 | $6,175 | $25,368 |
| 2023 | $8,964 | $33,000 | $6,175 | $26,825 |
| 2022 | $8,964 | $33,000 | $6,175 | $26,825 |
| 2021 | $8,324 | $27,464 | $4,225 | $23,239 |
| 2020 | $8,181 | $27,464 | $4,225 | $23,239 |
| 2019 | $8,556 | $31,920 | $4,225 | $27,695 |
| 2018 | $7,775 | $25,908 | $3,575 | $22,333 |
| 2017 | $6,656 | $25,908 | $3,575 | $22,333 |
| 2016 | $6,467 | $25,908 | $3,575 | $22,333 |
| 2015 | $5,926 | $22,432 | $3,087 | $19,345 |
| 2014 | $5,877 | $22,432 | $3,087 | $19,345 |
| 2013 | $5,709 | $22,432 | $3,087 | $19,345 |
Source: Public Records
Map
Nearby Homes
- 569 N Walnut Ln
- 741 N Walnut Ln
- 508 N Walnut Ln
- 454 Willington Dr
- 413 Linsey Ave
- 2216 Andover Ct
- 808 Bishop Ct Unit 2
- 604 N Brookdale Dr
- 2342 Hamilton Place
- 1912 Finchley Ct Unit 3
- 1929 Hastings Ct Unit 3
- 8 Warwick Ct
- 775 Harmon Blvd
- 700 N Hundley St
- 1924 Quaker Hollow Ln Unit 14
- 1916 Quaker Hollow Ln Unit 14
- 1968 Quaker Hollow Ln Unit 12
- 133 White Branch Ct S Unit 539
- 2317 Broadway Ln
- 198 Camden Ct Unit Z2
- 624 Linsey Ave
- 636 Linsey Ave
- 631 N Walnut Ln
- 625 N Walnut Ln
- 637 N Walnut Ln Unit 19
- 620 Linsey Ave
- 631 Linsey Ave
- 625 Linsey Ave
- 619 N Walnut Ln
- 637 Linsey Ave
- 614 Linsey Ave
- 619 Linsey Ave
- 2056 Lawson Rd
- 2062 Lawson Rd
- 613 N Walnut Ln
- 2050 Lawson Rd
- 2068 Lawson Rd
- 613 Linsey Ave
- 1927 Lawson Rd
- 632 N Walnut Ln