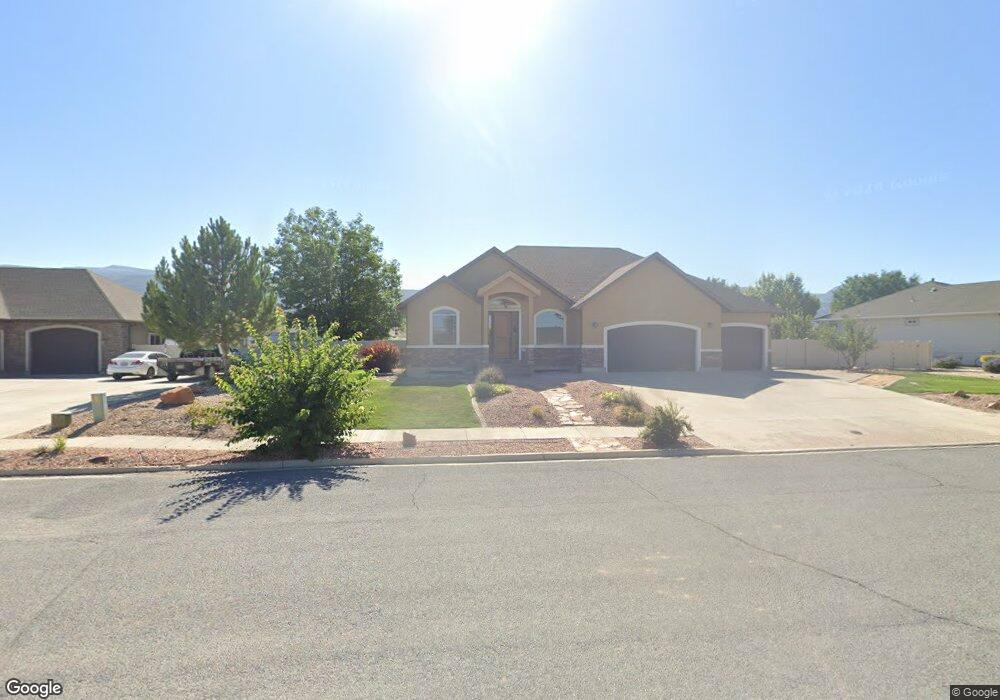
630 N 470 E Ephraim, UT 84627
Estimated Value: $509,000 - $608,000
5
Beds
3
Baths
4,200
Sq Ft
$138/Sq Ft
Est. Value
About This Home
This home is located at 630 N 470 E, Ephraim, UT 84627 and is currently estimated at $579,710, approximately $138 per square foot. 630 N 470 E is a home located in Sanpete County.
Ownership History
Date
Name
Owned For
Owner Type
Purchase Details
Closed on
Nov 30, 2015
Sold by
Russell Johnson and Russell Cheris
Bought by
Clarke Manning
Current Estimated Value
Home Financials for this Owner
Home Financials are based on the most recent Mortgage that was taken out on this home.
Original Mortgage
$264,600
Outstanding Balance
$208,270
Interest Rate
3.73%
Mortgage Type
New Conventional
Estimated Equity
$371,440
Purchase Details
Closed on
Sep 18, 2006
Sold by
Cherry Hal L and Nelson Jim R
Bought by
Johnson Russell Evan and Johnson Cheris
Purchase Details
Closed on
Jul 21, 2006
Sold by
Danish Developments Llc
Bought by
Cherry Hal L and Nelson Jim R
Create a Home Valuation Report for This Property
The Home Valuation Report is an in-depth analysis detailing your home's value as well as a comparison with similar homes in the area
Home Values in the Area
Average Home Value in this Area
Purchase History
| Date | Buyer | Sale Price | Title Company |
|---|---|---|---|
| Clarke Manning | $330,750 | Central Utah Title | |
| Johnson Russell Evan | -- | -- | |
| Cherry Hal L | -- | -- |
Source: Public Records
Mortgage History
| Date | Status | Borrower | Loan Amount |
|---|---|---|---|
| Open | Clarke Manning | $264,600 |
Source: Public Records
Tax History Compared to Growth
Tax History
| Year | Tax Paid | Tax Assessment Tax Assessment Total Assessment is a certain percentage of the fair market value that is determined by local assessors to be the total taxable value of land and additions on the property. | Land | Improvement |
|---|---|---|---|---|
| 2024 | $3,566 | $328,306 | $0 | $0 |
| 2023 | $3,518 | $308,268 | $0 | $0 |
| 2022 | $3,261 | $260,394 | $0 | $0 |
| 2021 | $3,484 | $240,463 | $0 | $0 |
| 2020 | $5,842 | $379,543 | $0 | $0 |
| 2019 | $3,118 | $199,315 | $0 | $0 |
| 2018 | $2,814 | $315,123 | $47,500 | $267,623 |
| 2017 | $2,436 | $157,064 | $0 | $0 |
| 2016 | $2,232 | $143,953 | $0 | $0 |
| 2015 | $2,243 | $143,953 | $0 | $0 |
| 2014 | $2,207 | $143,953 | $0 | $0 |
| 2013 | $2,196 | $143,953 | $0 | $0 |
Source: Public Records
Map
Nearby Homes