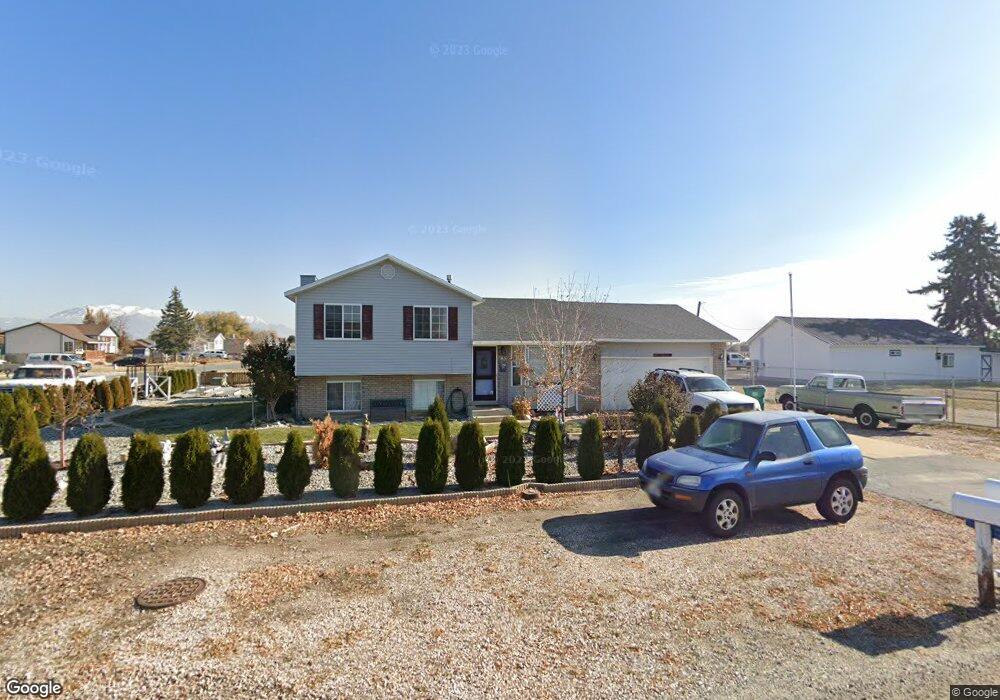
630 N 5000 W Clearfield, UT 84015
Estimated Value: $342,000 - $473,000
4
Beds
2
Baths
1,626
Sq Ft
$269/Sq Ft
Est. Value
About This Home
This home is located at 630 N 5000 W, Clearfield, UT 84015 and is currently estimated at $436,659, approximately $268 per square foot. 630 N 5000 W is a home located in Davis County with nearby schools including West Point School, West Point Junior High School, and Syracuse High School.
Ownership History
Date
Name
Owned For
Owner Type
Purchase Details
Closed on
Mar 11, 2014
Sold by
Porter Tamera and Porter Russell
Bought by
Eastman Michael and Eastman Debra K
Current Estimated Value
Home Financials for this Owner
Home Financials are based on the most recent Mortgage that was taken out on this home.
Original Mortgage
$162,011
Outstanding Balance
$122,464
Interest Rate
4.5%
Mortgage Type
FHA
Estimated Equity
$314,195
Purchase Details
Closed on
Oct 26, 2006
Sold by
Lewis Patricia Hutchings
Bought by
Porter Tamera and Porter Russell
Purchase Details
Closed on
Jan 19, 2004
Sold by
The Lewis Family Trust
Bought by
Lewis Patricia
Purchase Details
Closed on
Sep 1, 2000
Sold by
Lewis Ron
Bought by
Lewis Paul Ronald and Lewis Patricia Hutchings
Purchase Details
Closed on
Aug 26, 1996
Sold by
Willey Alonzo C and Willey Evelyn M
Bought by
Lewis Ron
Create a Home Valuation Report for This Property
The Home Valuation Report is an in-depth analysis detailing your home's value as well as a comparison with similar homes in the area
Home Values in the Area
Average Home Value in this Area
Purchase History
| Date | Buyer | Sale Price | Title Company |
|---|---|---|---|
| Eastman Michael | -- | Cornerstone Title Ins | |
| Porter Tamera | -- | Title Company Of Utah | |
| Lewis Patricia | -- | -- | |
| Lewis Paul Ronald | -- | Associated Title Company | |
| Lewis Ron | -- | First American Title Co |
Source: Public Records
Mortgage History
| Date | Status | Borrower | Loan Amount |
|---|---|---|---|
| Open | Eastman Michael | $162,011 |
Source: Public Records
Tax History
| Year | Tax Paid | Tax Assessment Tax Assessment Total Assessment is a certain percentage of the fair market value that is determined by local assessors to be the total taxable value of land and additions on the property. | Land | Improvement |
|---|---|---|---|---|
| 2025 | $2,438 | $224,400 | $102,866 | $121,534 |
| 2024 | $2,363 | $218,350 | $92,632 | $125,718 |
| 2023 | $2,172 | $369,000 | $114,130 | $254,870 |
| 2022 | $2,335 | $217,250 | $58,998 | $158,252 |
| 2021 | $2,171 | $302,000 | $93,617 | $208,383 |
| 2020 | $1,898 | $260,000 | $78,384 | $181,616 |
| 2019 | $1,838 | $248,000 | $76,126 | $171,874 |
| 2018 | $1,686 | $224,000 | $76,708 | $147,292 |
| 2016 | $1,542 | $107,470 | $29,654 | $77,816 |
| 2015 | $1,454 | $96,030 | $29,654 | $66,376 |
| 2014 | $1,405 | $93,950 | $29,654 | $64,296 |
| 2013 | -- | $63,324 | $19,646 | $43,678 |
Source: Public Records
Map
Nearby Homes
- 4901 W 650 N
- 1156 N 5150 W
- 477 N 4500 W
- 113 N 4950 W
- 4669 W 75 N
- 128 N 4500 W
- 120 N 4325 W
- 4362 West St Unit 106
- 4358 West St Unit 105
- 774 N 4000 W
- 3902 W 825 N
- 356 S 4300 W Unit 611
- 364 S 4300 W Unit 610
- 4260 W 350 S
- 372 S 4300 W Unit 609
- 388 S 4300 W Unit 607
- 396 S 4300 W
- 387 S 4250 W
- 148 N 3830 W
- 114 3830 W
Your Personal Tour Guide
Ask me questions while you tour the home.