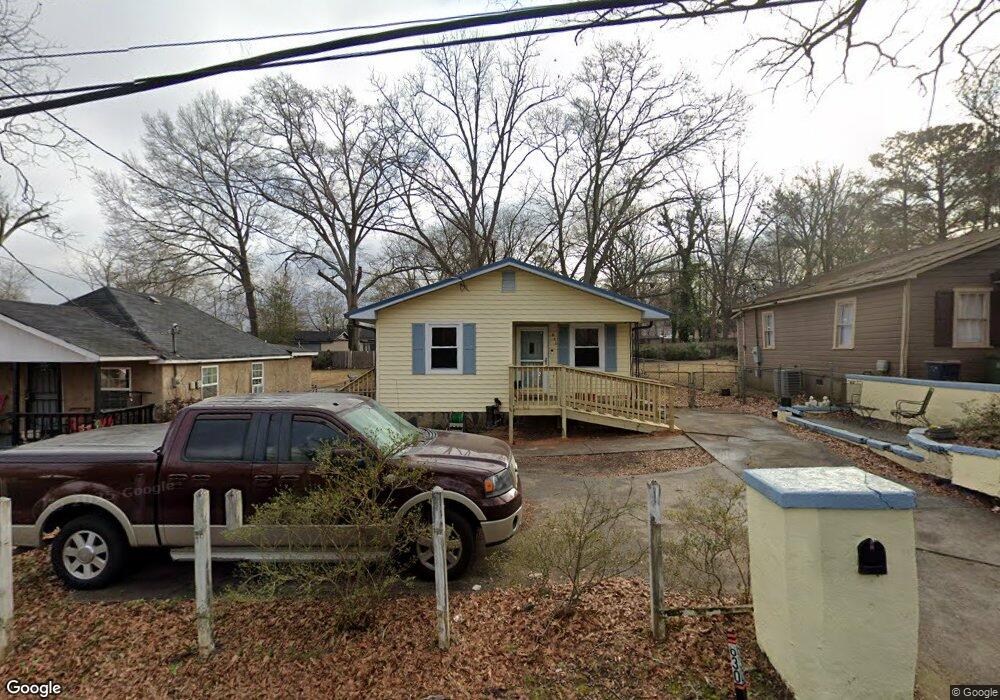
630 N 9th St Griffin, GA 30223
Spalding County NeighborhoodEstimated Value: $113,810 - $148,000
3
Beds
1
Bath
1,344
Sq Ft
$94/Sq Ft
Est. Value
About This Home
This home is located at 630 N 9th St, Griffin, GA 30223 and is currently estimated at $125,953, approximately $93 per square foot. 630 N 9th St is a home located in Spalding County with nearby schools including Moore Elementary School, Kennedy Road Middle School, and Griffin High School.
Ownership History
Date
Name
Owned For
Owner Type
Purchase Details
Closed on
Apr 27, 2023
Sold by
Terrell Debora F
Bought by
Terrell Debora F and Terrell Carental Alkeem
Current Estimated Value
Purchase Details
Closed on
Jan 2, 1985
Sold by
Fuller Genius and Fuller Debora W
Bought by
Fuller Debora W
Purchase Details
Closed on
Feb 27, 1978
Sold by
White Roy C
Bought by
Fuller Genius and Fuller Debora W
Purchase Details
Closed on
Apr 23, 1955
Bought by
White Roy C
Create a Home Valuation Report for This Property
The Home Valuation Report is an in-depth analysis detailing your home's value as well as a comparison with similar homes in the area
Home Values in the Area
Average Home Value in this Area
Purchase History
| Date | Buyer | Sale Price | Title Company |
|---|---|---|---|
| Terrell Debora F | -- | -- | |
| Fuller Debora W | -- | -- | |
| Fuller Genius | $22,500 | -- | |
| White Roy C | -- | -- |
Source: Public Records
Tax History Compared to Growth
Tax History
| Year | Tax Paid | Tax Assessment Tax Assessment Total Assessment is a certain percentage of the fair market value that is determined by local assessors to be the total taxable value of land and additions on the property. | Land | Improvement |
|---|---|---|---|---|
| 2024 | $517 | $26,400 | $3,840 | $22,560 |
| 2023 | $517 | $24,691 | $3,200 | $21,491 |
| 2022 | $434 | $20,949 | $2,000 | $18,949 |
| 2021 | $620 | $17,867 | $2,000 | $15,867 |
| 2020 | $620 | $17,867 | $2,000 | $15,867 |
| 2019 | $632 | $17,867 | $2,000 | $15,867 |
| 2018 | $586 | $16,236 | $2,000 | $14,236 |
| 2017 | $573 | $16,236 | $2,000 | $14,236 |
| 2016 | $599 | $16,636 | $2,400 | $14,236 |
| 2015 | $609 | $16,636 | $2,400 | $14,236 |
| 2014 | $627 | $16,636 | $2,400 | $14,236 |
Source: Public Records
Map
Nearby Homes
- 3939 Georgia Highway 3 Old Atl Rd
- 606 N 9th St
- 607 Lane St
- 135 Alabama St
- 554 N 8th St
- 546 N 8th St
- 514 Lane St
- 435 W Cherry St
- 441 W Cherry St
- 566 N 13th St
- 418 N 9th St
- 533 Belle St
- 117 Thurman St
- 517 Belle St
- 525 W Quilly St
- 730 Hallyburton St
- 411 Palace St
- 106 E Cherry St
- 102 E Cherry St
- 312.37 AC W Ellis Rd