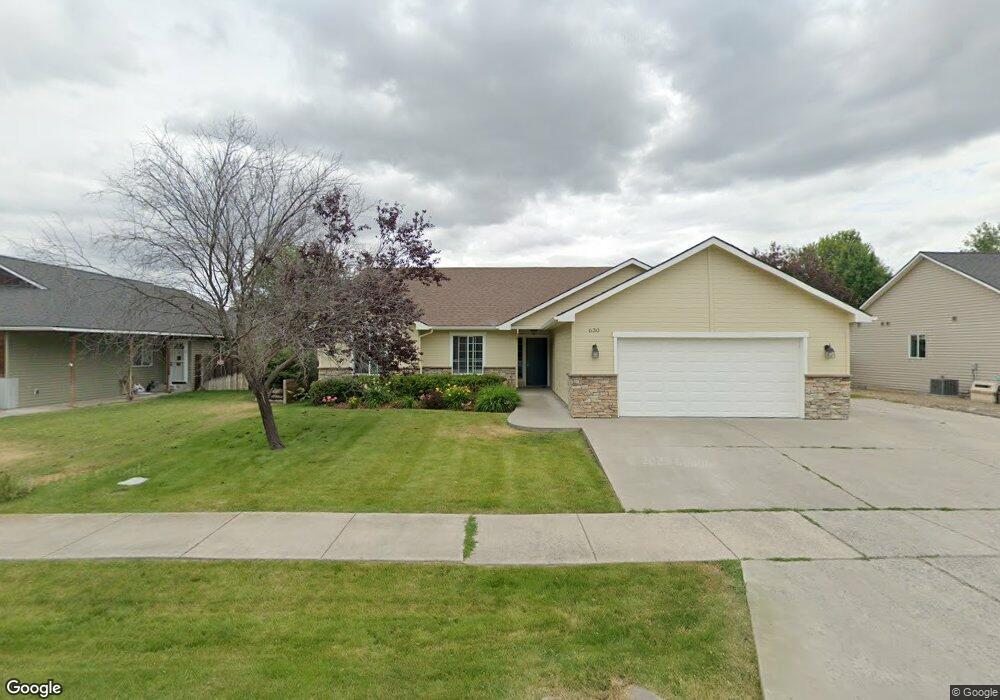
630 N Elm Rd Post Falls, ID 83854
Estimated Value: $475,000 - $532,000
3
Beds
2
Baths
2,042
Sq Ft
$244/Sq Ft
Est. Value
About This Home
This home is located at 630 N Elm Rd, Post Falls, ID 83854 and is currently estimated at $498,960, approximately $244 per square foot. 630 N Elm Rd is a home with nearby schools including West Ridge Elementary School, River City Middle School, and Post Falls High School.
Ownership History
Date
Name
Owned For
Owner Type
Purchase Details
Closed on
Mar 17, 2016
Sold by
Seven Oaks Properties I Llc
Bought by
Davis Carol A and Davis Richard
Current Estimated Value
Home Financials for this Owner
Home Financials are based on the most recent Mortgage that was taken out on this home.
Original Mortgage
$156,800
Outstanding Balance
$125,551
Interest Rate
4.25%
Mortgage Type
Adjustable Rate Mortgage/ARM
Estimated Equity
$373,409
Purchase Details
Closed on
Jul 27, 2012
Sold by
Davis A Richard and Davis Carol A
Bought by
Seven Oaks Properties Llc
Purchase Details
Closed on
Nov 23, 2007
Sold by
Chalich Connie L
Bought by
Davis A Richard and Davis Carol A
Home Financials for this Owner
Home Financials are based on the most recent Mortgage that was taken out on this home.
Original Mortgage
$35,250
Interest Rate
6.38%
Mortgage Type
Purchase Money Mortgage
Create a Home Valuation Report for This Property
The Home Valuation Report is an in-depth analysis detailing your home's value as well as a comparison with similar homes in the area
Purchase History
| Date | Buyer | Sale Price | Title Company |
|---|---|---|---|
| Davis Carol A | -- | Pioneer Title Co | |
| Seven Oaks Properties Llc | -- | None Available | |
| Davis A Richard | -- | -- |
Source: Public Records
Mortgage History
| Date | Status | Borrower | Loan Amount |
|---|---|---|---|
| Open | Davis Carol A | $156,800 | |
| Previous Owner | Davis A Richard | $35,250 |
Source: Public Records
Tax History
| Year | Tax Paid | Tax Assessment Tax Assessment Total Assessment is a certain percentage of the fair market value that is determined by local assessors to be the total taxable value of land and additions on the property. | Land | Improvement |
|---|---|---|---|---|
| 2025 | $3,203 | $536,360 | $165,000 | $371,360 |
| 2024 | $3,128 | $501,130 | $130,000 | $371,130 |
| 2023 | $3,128 | $542,264 | $160,000 | $382,264 |
| 2022 | $3,584 | $586,800 | $160,000 | $426,800 |
| 2021 | $3,830 | $382,810 | $110,000 | $272,810 |
| 2020 | $3,834 | $339,510 | $95,000 | $244,510 |
| 2019 | $3,845 | $307,350 | $78,000 | $229,350 |
| 2018 | $3,807 | $276,500 | $68,000 | $208,500 |
| 2017 | $3,799 | $253,070 | $50,000 | $203,070 |
| 2016 | $3,706 | $233,700 | $42,000 | $191,700 |
| 2015 | $3,432 | $212,660 | $32,000 | $180,660 |
| 2013 | $1,653 | $189,500 | $28,000 | $161,500 |
Source: Public Records
Map
Nearby Homes
- 590 N Stephanie St
- 957 N Maranatha Dr
- 2203 W Jester Way
- 7250 W Seltice Way
- 2135 W Seltice Way
- 0 W Seltice Way
- 5856 W Seltice Way
- 2087 W Seltice Way
- 1087 N Lean St
- 1513 N Wilhelm Way
- 1521 N Wilhelm Way
- 1531 N Wilhelm Way
- 2126 Lapwai Ave
- 0 Pleasant View Rd Unit 26-911
- 1435 N Minam Loop
- 2120 W Platte Ct
- L1B1 W Riverbend Ave
- 2084 W Platte Ct
- 2133 W Platte Ct
- 2097 W Platte Ct
- 600 N Elm Rd
- 640 N Elm Rd
- 615 N Stephanie St
- 18 N Elm Rd
- 629 N Stephanie St
- 603 N Stephanie St
- 650 N Elm Rd
- 590 N Elm Rd
- 601 N Elm Rd
- 645 N Elm Rd
- 641 N Stephanie St
- 591 N Stephanie St
- 2780 W Iago St
- 580 N Elm Rd
- 653 N Stephanie St
- 573 N Stephanie St
- 604 N Stephanie St
- 585 N Elm Rd
- 634 N Stephanie St
- 558 N Elm Rd
Your Personal Tour Guide
Ask me questions while you tour the home.