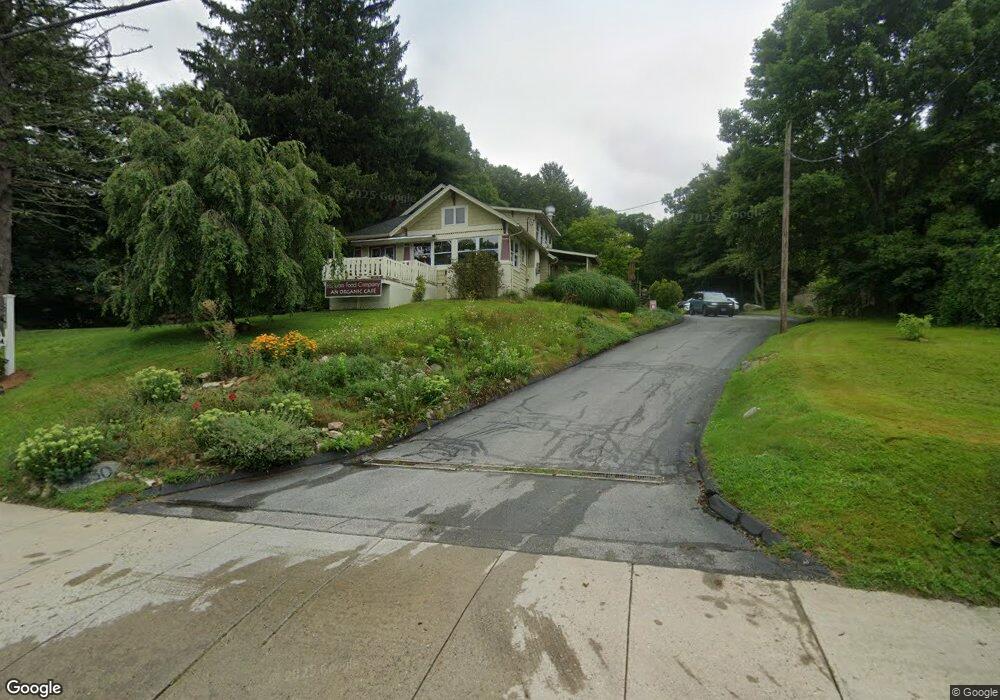
630 N Main St Danielson, CT 06239
Danielson NeighborhoodEstimated Value: $371,271
--
Bed
2
Baths
3,674
Sq Ft
$101/Sq Ft
Est. Value
About This Home
This home is located at 630 N Main St, Danielson, CT 06239 and is currently estimated at $371,271, approximately $101 per square foot. 630 N Main St is a home located in Windham County with nearby schools including Killingly Central School, Killingly Memorial School, and Killingly Intermediate School.
Ownership History
Date
Name
Owned For
Owner Type
Purchase Details
Closed on
Feb 28, 2012
Sold by
Wojcik Kenneth J and Wojcik Linda D
Bought by
Wojcik Joshua E and Garosshen Wendy L
Current Estimated Value
Home Financials for this Owner
Home Financials are based on the most recent Mortgage that was taken out on this home.
Original Mortgage
$125,600
Outstanding Balance
$89,121
Interest Rate
3.89%
Mortgage Type
Commercial
Estimated Equity
$288,816
Purchase Details
Closed on
Jun 15, 1992
Sold by
Desmarais Ex George
Bought by
Holm Michael and Holm Deborah
Create a Home Valuation Report for This Property
The Home Valuation Report is an in-depth analysis detailing your home's value as well as a comparison with similar homes in the area
Home Values in the Area
Average Home Value in this Area
Purchase History
Date | Buyer | Sale Price | Title Company |
---|---|---|---|
Wojcik Joshua E | $157,000 | -- | |
Holm Michael | $100,000 | -- | |
Holm Michael | $100,000 | -- |
Source: Public Records
Mortgage History
Date | Status | Borrower | Loan Amount |
---|---|---|---|
Open | Holm Michael | $125,600 | |
Closed | Holm Michael | $125,600 | |
Previous Owner | Holm Michael | $80,000 |
Source: Public Records
Tax History Compared to Growth
Tax History
Year | Tax Paid | Tax Assessment Tax Assessment Total Assessment is a certain percentage of the fair market value that is determined by local assessors to be the total taxable value of land and additions on the property. | Land | Improvement |
---|---|---|---|---|
2024 | $4,153 | $188,170 | $68,340 | $119,830 |
2023 | $4,454 | $155,470 | $56,770 | $98,700 |
2022 | $4,184 | $155,470 | $56,770 | $98,700 |
2021 | $4,184 | $155,470 | $56,770 | $98,700 |
2020 | $4,095 | $155,470 | $56,770 | $98,700 |
2019 | $4,176 | $155,470 | $56,770 | $98,700 |
2017 | $4,417 | $151,200 | $56,770 | $94,430 |
2016 | $4,401 | $151,200 | $56,770 | $94,430 |
2015 | $4,432 | $151,200 | $56,770 | $94,430 |
2014 | $4,311 | $151,200 | $56,770 | $94,430 |
Source: Public Records
Map
Nearby Homes