Estimated Value: $530,460 - $573,000
4
Beds
2
Baths
2,559
Sq Ft
$218/Sq Ft
Est. Value
About This Home
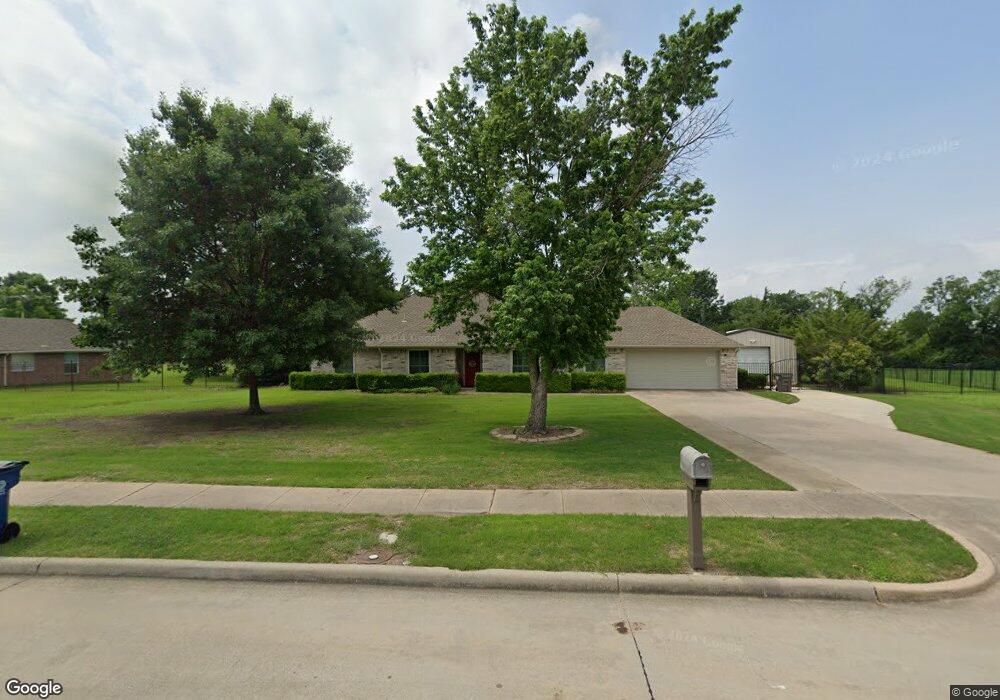
This home is located at 630 Oakbrook Dr, Wylie, TX 75098 and is currently estimated at $558,865, approximately $218 per square foot. 630 Oakbrook Dr is a home located in Collin County with nearby schools including R F Hartman Elementary School, AB Harrison Intermediate School, and Grady Burnett J High School.
Ownership History
Date
Name
Owned For
Owner Type
Purchase Details
Closed on
Mar 24, 2017
Sold by
Wyrem Greg and Wyrem Karen A
Bought by
Stewart Charles Max and Stewart Carla Diann
Current Estimated Value
Home Financials for this Owner
Home Financials are based on the most recent Mortgage that was taken out on this home.
Original Mortgage
$275,200
Outstanding Balance
$228,211
Interest Rate
4.17%
Mortgage Type
New Conventional
Estimated Equity
$330,654
Purchase Details
Closed on
Sep 28, 1998
Sold by
Goff Homes Inc
Bought by
Wyrem Greg and Wyrem Karen A
Home Financials for this Owner
Home Financials are based on the most recent Mortgage that was taken out on this home.
Original Mortgage
$119,650
Interest Rate
6.92%
Purchase Details
Closed on
Jun 5, 1998
Sold by
Wylie Stoneridge Farms Lp
Bought by
Goff Homes Inc
Home Financials for this Owner
Home Financials are based on the most recent Mortgage that was taken out on this home.
Original Mortgage
$108,300
Interest Rate
7.17%
Mortgage Type
Construction
Create a Home Valuation Report for This Property
The Home Valuation Report is an in-depth analysis detailing your home's value as well as a comparison with similar homes in the area
Home Values in the Area
Average Home Value in this Area
Purchase History
| Date | Buyer | Sale Price | Title Company |
|---|---|---|---|
| Stewart Charles Max | -- | None Available | |
| Wyrem Greg | -- | -- | |
| Goff Homes Inc | -- | Commonwealth Land Title Co |
Source: Public Records
Mortgage History
| Date | Status | Borrower | Loan Amount |
|---|---|---|---|
| Open | Stewart Charles Max | $275,200 | |
| Previous Owner | Wyrem Greg | $119,650 | |
| Previous Owner | Goff Homes Inc | $108,300 |
Source: Public Records
Tax History Compared to Growth
Tax History
| Year | Tax Paid | Tax Assessment Tax Assessment Total Assessment is a certain percentage of the fair market value that is determined by local assessors to be the total taxable value of land and additions on the property. | Land | Improvement |
|---|---|---|---|---|
| 2025 | $5,886 | $534,740 | $135,000 | $399,740 |
| 2024 | $5,886 | $490,599 | $135,000 | $440,477 |
| 2023 | $5,886 | $445,999 | $135,000 | $310,999 |
| 2022 | $8,926 | $406,864 | $135,000 | $365,975 |
| 2021 | $8,639 | $367,172 | $90,000 | $277,172 |
| 2020 | $8,446 | $340,161 | $70,000 | $270,161 |
| 2019 | $9,305 | $354,103 | $70,000 | $284,103 |
| 2018 | $9,241 | $343,124 | $70,000 | $273,124 |
| 2017 | $7,172 | $298,748 | $60,000 | $238,748 |
| 2016 | $6,727 | $262,652 | $60,000 | $202,652 |
| 2015 | $5,823 | $220,102 | $48,000 | $172,102 |
Source: Public Records
Map
Nearby Homes
- 414 Briarwood Dr
- 416 Dogwood Dr
- 811 Forest Edge Ln
- 825 Forest Edge Ln
- 327 S 4th St
- 800 Twin Oaks Dr
- 820 Foxwood Ln
- 217 Cloudcroft Dr
- 306 Woodhollow Ct
- 314 Lake Texoma Dr
- 825 Foxwood Ln
- 300 Woodhollow Ct
- 216 Cedar Ridge St
- 329 S 2nd St
- 416 S 1st St
- 1306 Angel Fire Dr
- 104 Rushcreek Dr
- 1210 Iron Horse St
- 409 Cedar Ridge Dr
- 1201 E Stone Rd
- 640 Oakbrook Dr
- 620 Oakbrook Dr
- 650 Oakbrook Dr
- 801 Crestview Ln
- 610 Oakbrook Dr
- 811 Crestview Ln
- 641 Oakbrook Dr
- 800 Crestview Ln
- 821 Crestview Ln
- 660 Oakbrook Dr
- 651 Oakbrook Dr
- 507 Thomas St
- 810 Crestview Ln
- 600 Oakbrook Dr
- 831 Crestview Ln
- 820 Crestview Ln
- 801 Oakbrook Dr
- 640 Stoneridge Dr
- 606 E Stone Rd
- 830 Crestview Ln