Estimated Value: $241,000 - $284,000
3
Beds
2
Baths
2,064
Sq Ft
$124/Sq Ft
Est. Value
About This Home
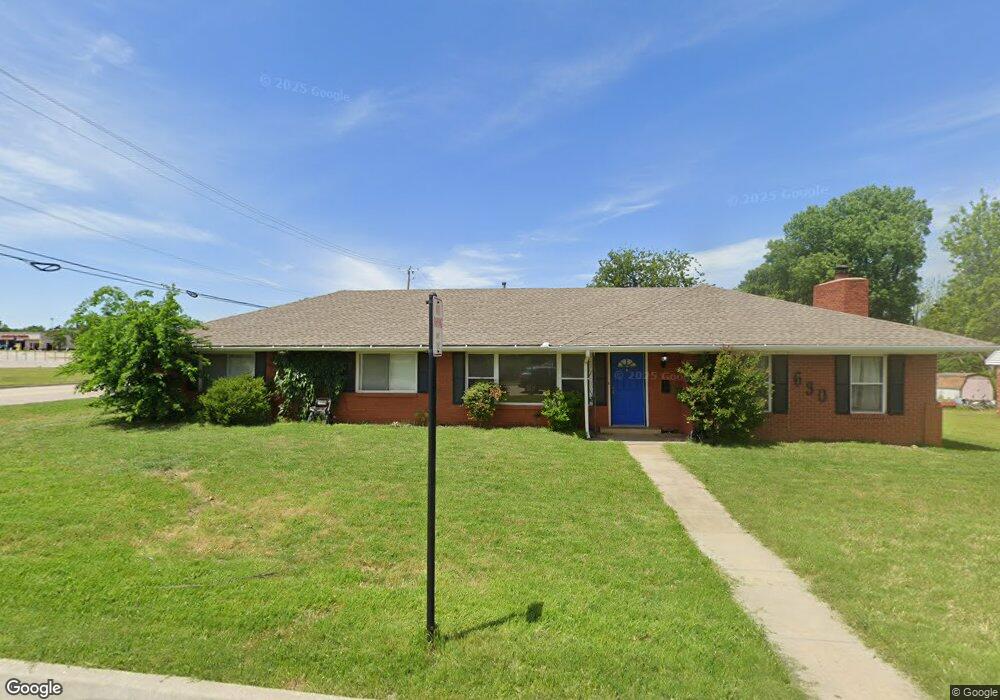
This home is located at 630 S 10th St, Yukon, OK 73099 and is currently estimated at $256,291, approximately $124 per square foot. 630 S 10th St is a home located in Canadian County with nearby schools including Central Elementary School, Independence Elementary School, and Yukon Middle School.
Ownership History
Date
Name
Owned For
Owner Type
Purchase Details
Closed on
Apr 19, 2011
Sold by
Littlefield Randy R and Littlefield Charlene J
Bought by
Howell Nicky J
Current Estimated Value
Home Financials for this Owner
Home Financials are based on the most recent Mortgage that was taken out on this home.
Original Mortgage
$141,602
Outstanding Balance
$100,825
Interest Rate
5.5%
Mortgage Type
FHA
Estimated Equity
$155,466
Purchase Details
Closed on
Jun 29, 2009
Sold by
Smith Jason and Smith Brenda
Bought by
Littlefield Randy R and Littlefield Charlene J
Home Financials for this Owner
Home Financials are based on the most recent Mortgage that was taken out on this home.
Original Mortgage
$127,645
Interest Rate
4.83%
Mortgage Type
FHA
Purchase Details
Closed on
Jul 27, 2007
Sold by
Bailey Carlton Clay and Bailey Laura M
Bought by
Independent School District No 27
Purchase Details
Closed on
Oct 8, 2002
Sold by
Raab Jerry and Raab Jennifer
Home Financials for this Owner
Home Financials are based on the most recent Mortgage that was taken out on this home.
Original Mortgage
$75,000
Interest Rate
6.2%
Purchase Details
Closed on
Jan 31, 1997
Sold by
Ferguson Thomas Ray
Create a Home Valuation Report for This Property
The Home Valuation Report is an in-depth analysis detailing your home's value as well as a comparison with similar homes in the area
Home Values in the Area
Average Home Value in this Area
Purchase History
| Date | Buyer | Sale Price | Title Company |
|---|---|---|---|
| Howell Nicky J | $147,000 | Ort | |
| Littlefield Randy R | $130,000 | Agt | |
| Independent School District No 27 | $110,000 | None Available | |
| -- | $95,000 | -- | |
| -- | $68,000 | -- |
Source: Public Records
Mortgage History
| Date | Status | Borrower | Loan Amount |
|---|---|---|---|
| Open | Howell Nicky J | $141,602 | |
| Previous Owner | Littlefield Randy R | $127,645 | |
| Previous Owner | -- | $75,000 |
Source: Public Records
Tax History Compared to Growth
Tax History
| Year | Tax Paid | Tax Assessment Tax Assessment Total Assessment is a certain percentage of the fair market value that is determined by local assessors to be the total taxable value of land and additions on the property. | Land | Improvement |
|---|---|---|---|---|
| 2024 | $1,919 | $19,269 | $3,135 | $16,134 |
| 2023 | $1,919 | $18,709 | $2,909 | $15,800 |
| 2022 | $1,868 | $18,164 | $2,640 | $15,524 |
| 2021 | $1,827 | $17,734 | $2,640 | $15,094 |
| 2020 | $1,828 | $17,949 | $2,640 | $15,309 |
| 2019 | $1,781 | $17,463 | $2,640 | $14,823 |
| 2018 | $1,731 | $16,954 | $2,640 | $14,314 |
| 2017 | $1,712 | $16,776 | $2,640 | $14,136 |
| 2016 | $1,660 | $16,589 | $2,640 | $13,949 |
| 2015 | $1,633 | $15,813 | $2,640 | $13,173 |
| 2014 | $1,633 | $15,813 | $2,640 | $13,173 |
Source: Public Records
Map
Nearby Homes
- 9116 Anaum Ln
- 624 Frisco Ridge Rd
- 417 Garth Brooks Blvd
- 11325 SW 34th Terrace
- 705 Yukon Ave
- 600 S 8th St
- 601 S 8th St
- 1016 Maple Ave
- 621 Yukon Ave
- 740 Kingston Dr
- 616 Kingston Dr
- 744 Kingston Dr
- 709 Hamlet Ln
- 1101 W Main St
- 1004 Cedar Ave
- 3509 Sawtooth Ridge Dr
- 3608 Northover Ridge Dr
- 11020 SW 34th Terrace
- 10401 NW 33rd St
- 12033 SW 31st St