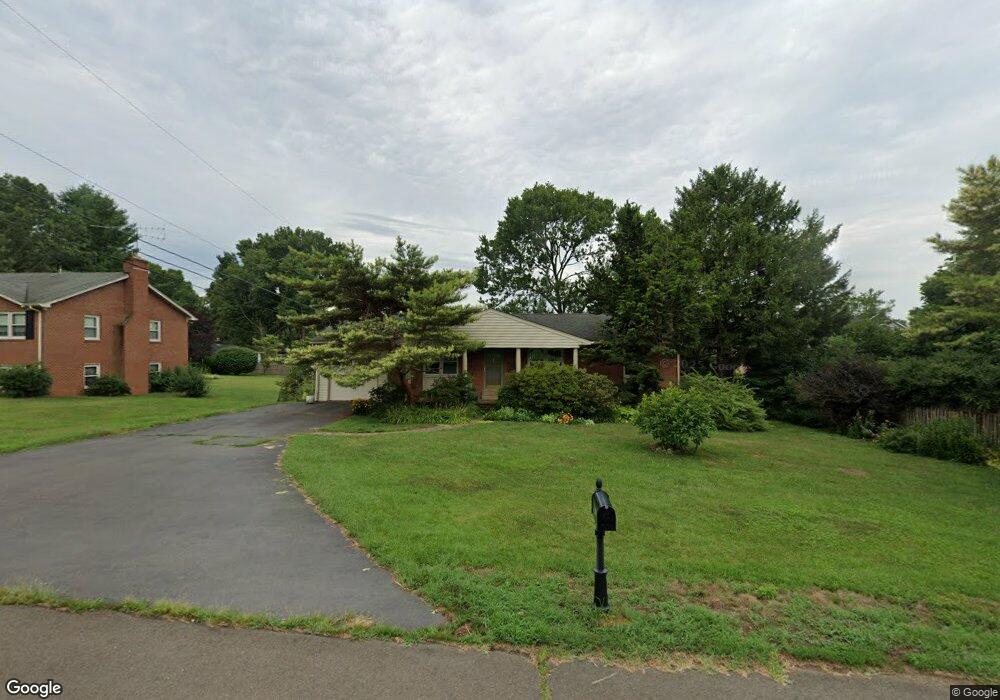
630 Short St Warrenton, VA 20186
Estimated Value: $546,717 - $624,000
3
Beds
3
Baths
2,908
Sq Ft
$200/Sq Ft
Est. Value
About This Home
This home is located at 630 Short St, Warrenton, VA 20186 and is currently estimated at $580,679, approximately $199 per square foot. 630 Short St is a home located in Fauquier County with nearby schools including Fauquier High School, Highland School, and St John Evangelist Elementary School.
Ownership History
Date
Name
Owned For
Owner Type
Purchase Details
Closed on
Jun 15, 2011
Sold by
Bradley Thomas L
Bought by
Pennington Barbara D
Current Estimated Value
Home Financials for this Owner
Home Financials are based on the most recent Mortgage that was taken out on this home.
Original Mortgage
$228,000
Outstanding Balance
$157,988
Interest Rate
4.74%
Mortgage Type
New Conventional
Estimated Equity
$422,691
Purchase Details
Closed on
Aug 13, 1998
Sold by
Strojni Albert B
Bought by
Bradley Thomas L
Home Financials for this Owner
Home Financials are based on the most recent Mortgage that was taken out on this home.
Original Mortgage
$120,000
Interest Rate
6.94%
Purchase Details
Closed on
Mar 25, 1994
Sold by
Ha Wicht
Bought by
Strojni Albert B
Home Financials for this Owner
Home Financials are based on the most recent Mortgage that was taken out on this home.
Original Mortgage
$148,320
Interest Rate
7.15%
Create a Home Valuation Report for This Property
The Home Valuation Report is an in-depth analysis detailing your home's value as well as a comparison with similar homes in the area
Home Values in the Area
Average Home Value in this Area
Purchase History
| Date | Buyer | Sale Price | Title Company |
|---|---|---|---|
| Pennington Barbara D | $285,000 | -- | |
| Bradley Thomas L | $155,000 | -- | |
| Strojni Albert B | $149,000 | -- |
Source: Public Records
Mortgage History
| Date | Status | Borrower | Loan Amount |
|---|---|---|---|
| Open | Pennington Barbara D | $228,000 | |
| Previous Owner | Bradley Thomas L | $120,000 | |
| Previous Owner | Strojni Albert B | $148,320 |
Source: Public Records
Tax History Compared to Growth
Tax History
| Year | Tax Paid | Tax Assessment Tax Assessment Total Assessment is a certain percentage of the fair market value that is determined by local assessors to be the total taxable value of land and additions on the property. | Land | Improvement |
|---|---|---|---|---|
| 2025 | $3,971 | $410,600 | $125,000 | $285,600 |
| 2024 | $3,872 | $410,600 | $125,000 | $285,600 |
| 2023 | $3,708 | $410,600 | $125,000 | $285,600 |
| 2022 | $3,708 | $410,600 | $125,000 | $285,600 |
| 2021 | $3,410 | $343,100 | $120,000 | $223,100 |
| 2020 | $3,410 | $343,100 | $120,000 | $223,100 |
| 2019 | $3,410 | $343,100 | $120,000 | $223,100 |
| 2018 | $3,369 | $343,100 | $120,000 | $223,100 |
| 2016 | $2,983 | $287,100 | $100,000 | $187,100 |
| 2015 | -- | $287,100 | $100,000 | $187,100 |
| 2014 | -- | $287,100 | $100,000 | $187,100 |
Source: Public Records
Map
Nearby Homes
- 141 Blue Ridge St
- 28 Piedmont St
- 351 Chappell St
- 305 Jackson St
- 562 Tiffany Ct
- 507 Winchester St
- 0 Winchester St
- 273 Waterloo St
- 535 Winchester St
- 129 Fairfax St
- 565 Solgrove Rd
- 575 Solgrove Rd
- 335 Preston Dr
- 155 Royal Ct
- 71 Sire Way
- 839 Oak Leaf Ct
- LOT 1 Blackwell Rd
- 748 Cherry Tree Ln
- 3044 Clearview Farm
- 311 Winterset Ln