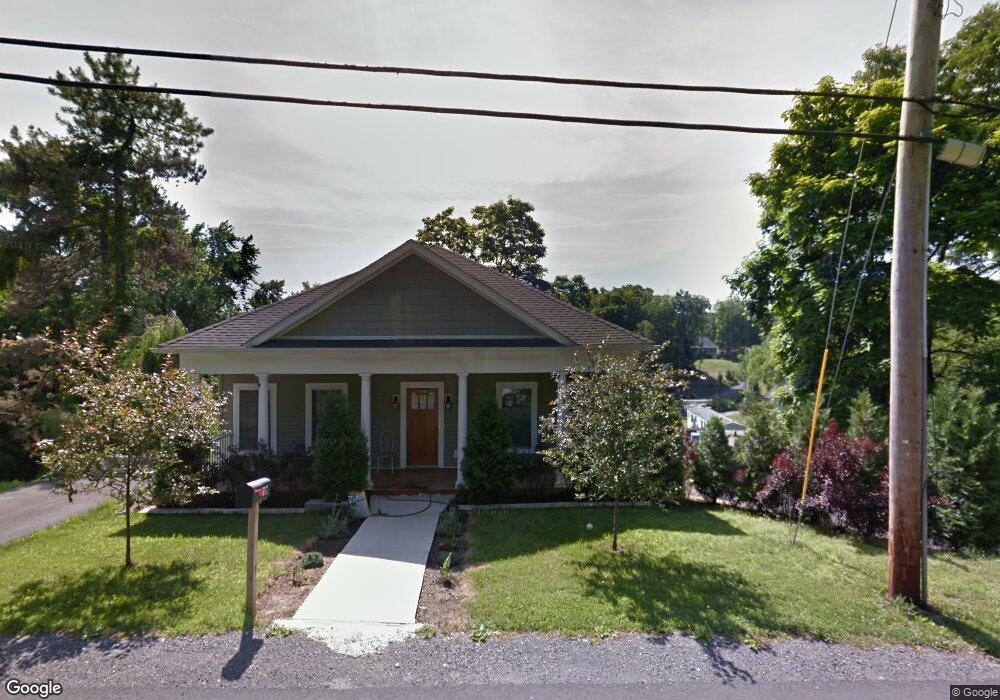
630 South Rd Milton, NY 12547
Estimated Value: $305,000 - $476,090
3
Beds
3
Baths
2,176
Sq Ft
$193/Sq Ft
Est. Value
About This Home
This home is located at 630 South Rd, Milton, NY 12547 and is currently estimated at $419,023, approximately $192 per square foot. 630 South Rd is a home located in Ulster County with nearby schools including Marlboro Central High School.
Ownership History
Date
Name
Owned For
Owner Type
Purchase Details
Closed on
Feb 27, 2009
Sold by
Dean Paul Properties
Bought by
Kosta Fredi
Current Estimated Value
Purchase Details
Closed on
Jun 22, 2006
Sold by
T N J & Associates Inc
Bought by
Dean Paul Properties Inc
Purchase Details
Closed on
May 19, 2006
Sold by
The County Of Ulster
Bought by
Amr Realty Associates Llc
Purchase Details
Closed on
Jun 6, 2005
Sold by
Amr Realty Associates Llc
Bought by
T N J & Associates Inc
Purchase Details
Closed on
Sep 22, 2000
Sold by
The County Of Ulster
Bought by
Amr Realty Associates Llc
Purchase Details
Closed on
Feb 22, 1999
Sold by
Bilyou Michael
Bought by
Bilyou Fred and Bilyou Lucille
Create a Home Valuation Report for This Property
The Home Valuation Report is an in-depth analysis detailing your home's value as well as a comparison with similar homes in the area
Home Values in the Area
Average Home Value in this Area
Purchase History
| Date | Buyer | Sale Price | Title Company |
|---|---|---|---|
| Kosta Fredi | $220,000 | -- | |
| Dean Paul Properties Inc | $35,000 | Commonwealth Land Title Insu | |
| Amr Realty Associates Llc | $8,746 | None Available | |
| T N J & Associates Inc | -- | Commonwealth Land Title Insu | |
| Amr Realty Associates Llc | $10,000 | -- | |
| Bilyou Fred | -- | -- |
Source: Public Records
Tax History Compared to Growth
Tax History
| Year | Tax Paid | Tax Assessment Tax Assessment Total Assessment is a certain percentage of the fair market value that is determined by local assessors to be the total taxable value of land and additions on the property. | Land | Improvement |
|---|---|---|---|---|
| 2024 | $8,248 | $186,200 | $61,000 | $125,200 |
| 2023 | $8,275 | $186,200 | $61,000 | $125,200 |
| 2022 | $8,429 | $186,200 | $61,000 | $125,200 |
| 2021 | $8,429 | $186,200 | $61,000 | $125,200 |
| 2020 | $8,549 | $186,200 | $61,000 | $125,200 |
| 2019 | $7,399 | $186,200 | $61,000 | $125,200 |
| 2018 | $7,485 | $186,200 | $61,000 | $125,200 |
| 2017 | $7,118 | $186,200 | $61,000 | $125,200 |
| 2016 | $7,172 | $186,200 | $61,000 | $125,200 |
| 2015 | -- | $186,200 | $61,000 | $125,200 |
| 2014 | -- | $186,200 | $61,000 | $125,200 |
Source: Public Records
Map
Nearby Homes