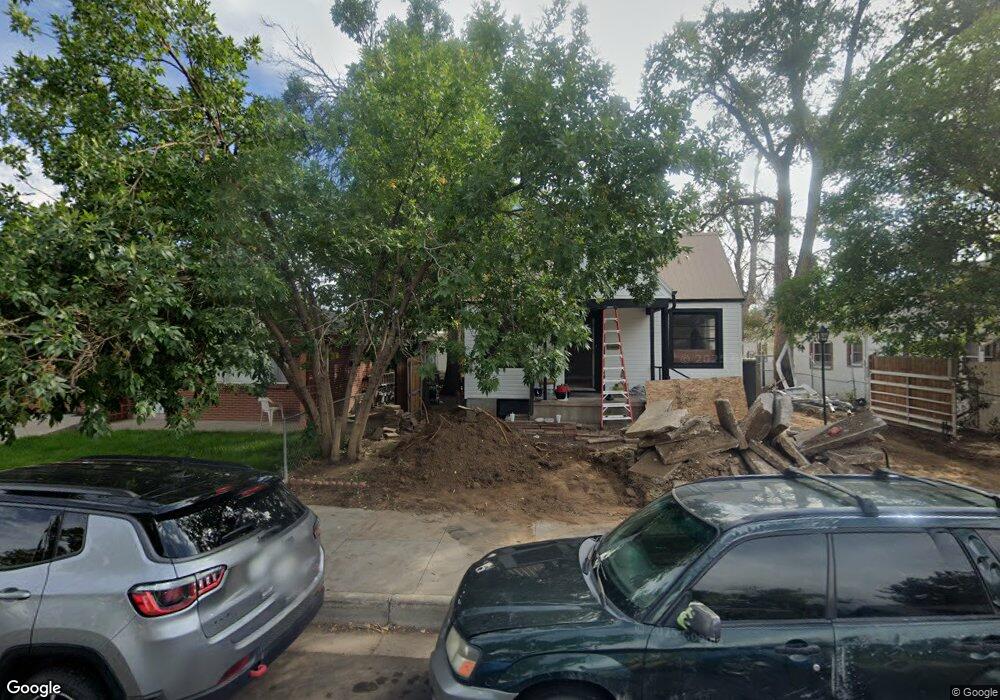
630 Stong St Brighton, CO 80601
Estimated Value: $397,000 - $454,354
3
Beds
2
Baths
1,174
Sq Ft
$374/Sq Ft
Est. Value
About This Home
This home is located at 630 Stong St, Brighton, CO 80601 and is currently estimated at $439,339, approximately $374 per square foot. 630 Stong St is a home located in Adams County with nearby schools including Northeast Elementary School, Overland Trail Middle School, and Brighton High School.
Ownership History
Date
Name
Owned For
Owner Type
Purchase Details
Closed on
Apr 17, 2023
Sold by
Barraza Jesus Faudoa
Bought by
Moquin Nicholas J and Breidenbach Aricka R
Current Estimated Value
Home Financials for this Owner
Home Financials are based on the most recent Mortgage that was taken out on this home.
Original Mortgage
$465,600
Outstanding Balance
$452,778
Interest Rate
6.65%
Mortgage Type
New Conventional
Estimated Equity
-$13,439
Purchase Details
Closed on
Aug 10, 2022
Sold by
Reinhardt Stephanie
Bought by
Faudoa Barraza Jesus and Lucero Macias Oralia
Purchase Details
Closed on
Mar 18, 2019
Sold by
Reinhardt Robert Arnold
Bought by
Reinhardt Stephanie and Reinhardt Michelle
Purchase Details
Closed on
Oct 25, 2013
Sold by
Reinhardt Nancy Sue
Bought by
Reinhardt Rboert A
Purchase Details
Closed on
Aug 30, 2000
Sold by
Reinhardt Hilda M
Bought by
Reinhardt Hilda M and Reinhardt Nancy Sue
Create a Home Valuation Report for This Property
The Home Valuation Report is an in-depth analysis detailing your home's value as well as a comparison with similar homes in the area
Home Values in the Area
Average Home Value in this Area
Purchase History
| Date | Buyer | Sale Price | Title Company |
|---|---|---|---|
| Moquin Nicholas J | $480,000 | Heritage Title | |
| Faudoa Barraza Jesus | $330,000 | First American Title | |
| Reinhardt Stephanie | -- | None Available | |
| Reinhardt Rboert A | -- | None Available | |
| Reinhardt Hilda M | -- | -- |
Source: Public Records
Mortgage History
| Date | Status | Borrower | Loan Amount |
|---|---|---|---|
| Open | Moquin Nicholas J | $465,600 |
Source: Public Records
Tax History Compared to Growth
Tax History
| Year | Tax Paid | Tax Assessment Tax Assessment Total Assessment is a certain percentage of the fair market value that is determined by local assessors to be the total taxable value of land and additions on the property. | Land | Improvement |
|---|---|---|---|---|
| 2024 | $2,470 | $25,620 | $5,310 | $20,310 |
| 2023 | $2,458 | $26,040 | $5,410 | $20,630 |
| 2022 | $2,174 | $19,790 | $4,930 | $14,860 |
| 2021 | $2,037 | $19,790 | $4,930 | $14,860 |
| 2020 | $1,910 | $19,340 | $4,860 | $14,480 |
| 2019 | $1,912 | $19,340 | $4,860 | $14,480 |
| 2018 | $1,483 | $15,000 | $4,750 | $10,250 |
| 2017 | $1,481 | $15,000 | $4,750 | $10,250 |
| 2016 | $933 | $9,420 | $2,390 | $7,030 |
| 2015 | $932 | $9,420 | $2,390 | $7,030 |
| 2014 | $1,085 | $11,130 | $1,910 | $9,220 |
Source: Public Records
Map
Nearby Homes
- 610 Walnut St
- 719 Walnut St
- 25 S 8th Ave
- 59 N 9th Ave Unit A & B
- 60 S 7th Ave
- 121 S 6th Ave
- 305 Strong St
- 113 S 4th Ave
- 146 N 10th Ave
- 126 S 9th Ave
- 276 N 9th Ave
- 263 N 10th Ave
- 135 S 3rd Ave
- 915 Longs Peak St Unit 915
- 175 S 10th Ave
- 255 N 11th Ave
- 285 S 8th Ave
- 338 N 9th Ave
- 219 S 3rd Ave
- 204 E Egbert St