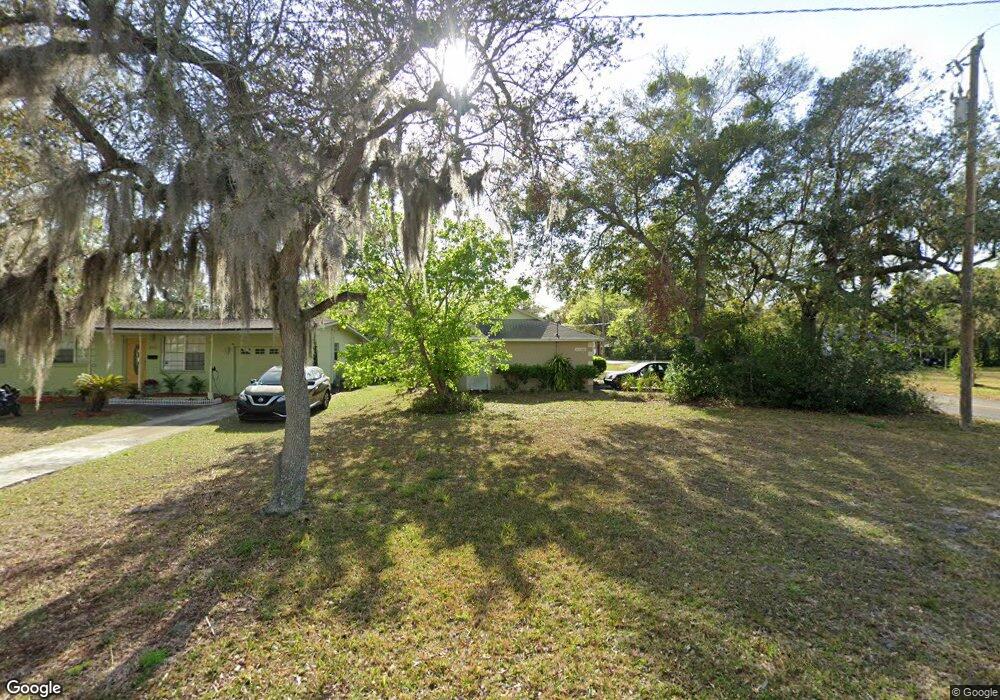
630 Tarragona Way Daytona Beach, FL 32114
Central Daytona NeighborhoodEstimated Value: $244,000 - $265,000
3
Beds
2
Baths
1,244
Sq Ft
$204/Sq Ft
Est. Value
About This Home
This home is located at 630 Tarragona Way, Daytona Beach, FL 32114 and is currently estimated at $253,539, approximately $203 per square foot. 630 Tarragona Way is a home located in Volusia County with nearby schools including Palm Terrace Elementary School, Campbell Middle School, and Mainland High School.
Ownership History
Date
Name
Owned For
Owner Type
Purchase Details
Closed on
Mar 2, 2018
Sold by
Singletary Clarence J and Singletary Ursula C
Bought by
Luby Kevin and Luby Heidi J
Current Estimated Value
Purchase Details
Closed on
Jul 1, 2015
Sold by
Floyd Aileen and Kane Marilyn
Bought by
Singletary Clarence J and Singletry Ursula C
Home Financials for this Owner
Home Financials are based on the most recent Mortgage that was taken out on this home.
Original Mortgage
$85,000
Interest Rate
3.92%
Mortgage Type
Seller Take Back
Purchase Details
Closed on
Jul 31, 2008
Sold by
Kane Richard
Bought by
Floyd Aileen and Kane Marilyn
Purchase Details
Closed on
Jan 10, 2006
Sold by
General American Financial Corp
Bought by
Kane Richard
Purchase Details
Closed on
Feb 28, 1997
Sold by
Prizzia Paul and Prizzia Santo
Bought by
Gen Amer Finl Corp
Purchase Details
Closed on
Jun 7, 1949
Sold by
Prioleau Philip Ford and Prioleau Hazel H
Bought by
Prizzia Santo T
Create a Home Valuation Report for This Property
The Home Valuation Report is an in-depth analysis detailing your home's value as well as a comparison with similar homes in the area
Home Values in the Area
Average Home Value in this Area
Purchase History
| Date | Buyer | Sale Price | Title Company |
|---|---|---|---|
| Luby Kevin | $123,500 | Waterside Title Co | |
| Singletary Clarence J | $120,000 | Attorney | |
| Floyd Aileen | $133,300 | Attorney | |
| Kane Richard | -- | None Available | |
| Gen Amer Finl Corp | $8,000 | -- | |
| Prizzia Santo T | -- | -- |
Source: Public Records
Mortgage History
| Date | Status | Borrower | Loan Amount |
|---|---|---|---|
| Previous Owner | Singletary Clarence J | $85,000 |
Source: Public Records
Tax History Compared to Growth
Tax History
| Year | Tax Paid | Tax Assessment Tax Assessment Total Assessment is a certain percentage of the fair market value that is determined by local assessors to be the total taxable value of land and additions on the property. | Land | Improvement |
|---|---|---|---|---|
| 2025 | $3,816 | $244,876 | $36,608 | $208,268 |
| 2024 | $3,816 | $242,913 | $36,608 | $206,305 |
| 2023 | $3,816 | $242,606 | $36,608 | $205,998 |
| 2022 | $3,646 | $244,035 | $19,448 | $224,587 |
| 2021 | $3,197 | $165,314 | $18,876 | $146,438 |
| 2020 | $3,195 | $165,069 | $12,584 | $152,485 |
| 2019 | $3,093 | $157,260 | $12,947 | $144,313 |
| 2018 | $2,931 | $152,741 | $12,947 | $139,794 |
| 2017 | $2,770 | $138,168 | $12,971 | $125,197 |
| 2016 | $2,577 | $115,712 | $0 | $0 |
| 2015 | $2,476 | $105,952 | $0 | $0 |
| 2014 | $2,498 | $106,647 | $0 | $0 |
Source: Public Records
Map
Nearby Homes
- 1111 Cedar St
- 617 S Seneca Blvd
- 517 S Lanvale Ave
- 765 Greenway Place
- 849 Terrace Ave
- 793 Greenway Place
- 357 S Seneca Blvd
- 835 Terrace Ave
- 839 Terrace Ave
- 303 S Seneca Blvd
- 1110 Australia Ave
- 1136 Australia Ave
- 444 S Caroline St
- 416 S Caroline St
- 215 Ponce de Leon Blvd
- 539 S Keech St
- 1223 Midway Blvd
- 0 Bellevue Ave Unit 1216778
- 837 Bellevue Ave
- 352 Aleatha Dr
- 632 Tarragona Way
- 1109 Madrid Ave
- 636 Tarragona Way
- 626 Tarragona Way
- 1110 Madrid Ave
- 1117 Madrid Ave
- 627 Tarragona Way
- 618 Tarragona Way
- 623 Tarragona Way
- 1116 Madrid Ave
- 635 Tarragona Way
- 614 Tarragona Way
- 1119 Madrid Ave
- 615 Tarragona Way
- 1122 Madrid Ave
- 1121 Madrid Ave
- 600 Tarragona Way
- 611 Tarragona Way
- 1115 Cedar St