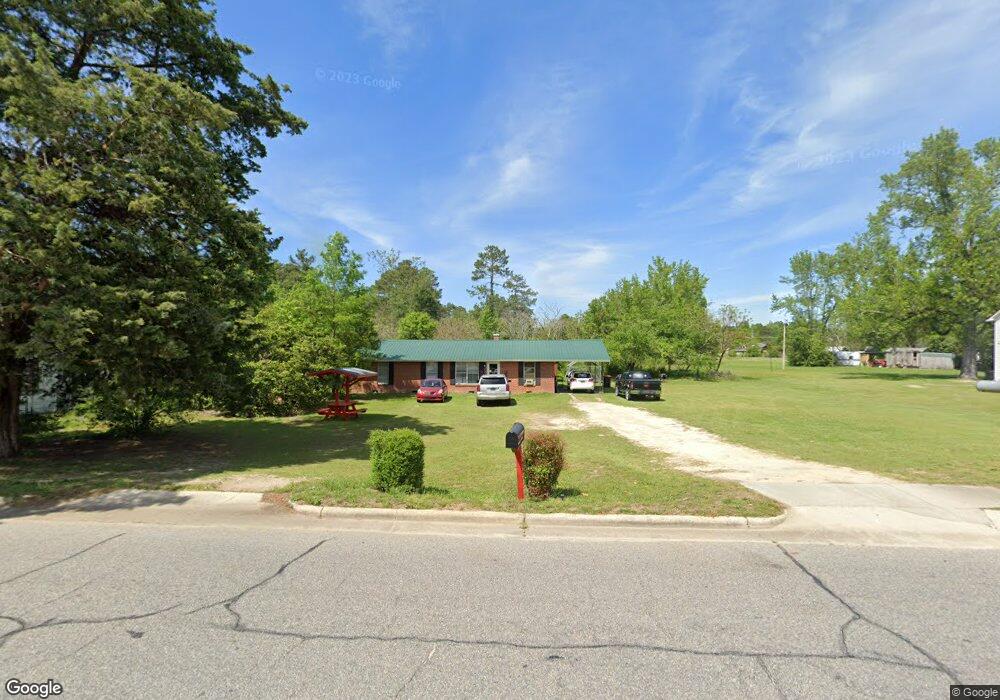
630 W 4th Ave Red Springs, NC 28377
Estimated Value: $75,000 - $137,000
3
Beds
2
Baths
1,250
Sq Ft
$95/Sq Ft
Est. Value
About This Home
This home is located at 630 W 4th Ave, Red Springs, NC 28377 and is currently estimated at $119,085, approximately $95 per square foot. 630 W 4th Ave is a home with nearby schools including Peterson Elementary School, Parkton Elementary School, and Red Springs Middle School.
Ownership History
Date
Name
Owned For
Owner Type
Purchase Details
Closed on
Oct 26, 2006
Sold by
Featherstone Willie
Bought by
Campbell Robert and Campbell Michelle
Current Estimated Value
Home Financials for this Owner
Home Financials are based on the most recent Mortgage that was taken out on this home.
Original Mortgage
$9,000
Outstanding Balance
$5,341
Interest Rate
6.27%
Mortgage Type
Unknown
Estimated Equity
$113,744
Purchase Details
Closed on
May 8, 2006
Sold by
Sinclair John
Bought by
Featherstone Willie
Create a Home Valuation Report for This Property
The Home Valuation Report is an in-depth analysis detailing your home's value as well as a comparison with similar homes in the area
Home Values in the Area
Average Home Value in this Area
Purchase History
| Date | Buyer | Sale Price | Title Company |
|---|---|---|---|
| Campbell Robert | $90,000 | -- | |
| Featherstone Willie | -- | -- |
Source: Public Records
Mortgage History
| Date | Status | Borrower | Loan Amount |
|---|---|---|---|
| Open | Campbell Robert | $9,000 | |
| Open | Campbell Robert | $76,500 |
Source: Public Records
Tax History Compared to Growth
Tax History
| Year | Tax Paid | Tax Assessment Tax Assessment Total Assessment is a certain percentage of the fair market value that is determined by local assessors to be the total taxable value of land and additions on the property. | Land | Improvement |
|---|---|---|---|---|
| 2025 | $1,449 | $98,500 | $5,500 | $93,000 |
| 2024 | $1,444 | $98,500 | $5,500 | $93,000 |
| 2023 | $1,133 | $76,700 | $5,000 | $71,700 |
| 2022 | $1,133 | $76,700 | $5,000 | $71,700 |
| 2021 | $1,133 | $76,700 | $5,000 | $71,700 |
| 2020 | $1,119 | $56,500 | $5,000 | $51,500 |
| 2018 | $1,141 | $46,100 | $5,000 | $41,100 |
| 2017 | $992 | $46,100 | $5,000 | $41,100 |
| 2016 | $992 | $46,100 | $5,000 | $41,100 |
| 2015 | $992 | $46,100 | $5,000 | $41,100 |
| 2014 | $992 | $46,100 | $5,000 | $41,100 |
Source: Public Records
Map
Nearby Homes