NOT LISTED FOR SALE

6300 A1a Unit A1-3D Out of Area, FL 32080

Butler and Crescent Beaches Neighborhood

Estimated Value: $372,574 - $417,000

2 Beds
2 Baths
1,004 Sq Ft
$394/Sq Ft Est. Value

Last Sold October 02, 2019

Last sale price $260,000 $259 Per Sq Ft

Est. 52% increase in value since last sale

Current estimated payment $2,878/month

About This Home

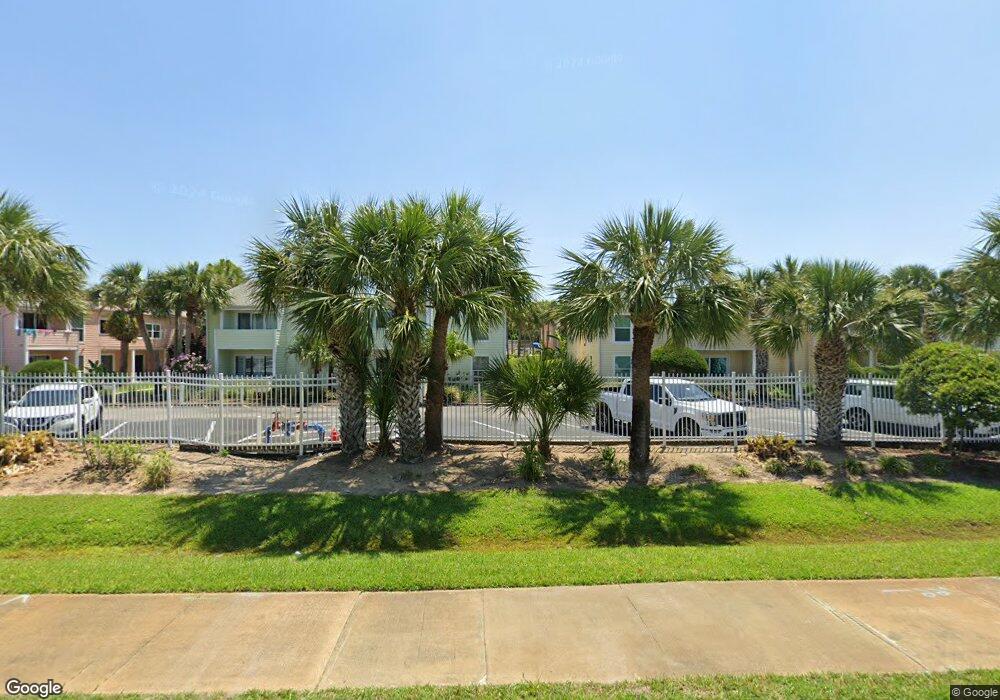
Oceanview condo atop a high beachfront dune in Quail Hollow, this 2 BR, 2BTH unit has been update with newer windows, doors which meet Miami Dade grade requirements, storm door, AC, knock down finishing to ceilings ,door fixtures, cabinetry in kitchen and baths, tile backsplash, farm sink, and granite countertops in kitchen, Washer/dryer, wood plank tile throughout, newer furniture, crown molding, and walkin master shower with glass blocks, and fresh paint, this beautiful unit is ready for enjoyment as an investment property where short term rentals are allowed or for your own residence. Offered fully furnished and ready for vacation rental market if preferred.
Easy private beach access and community pool nearby.
Come take a look!! No water intrusion here with the high dune elevation! One of the owners is a licensed real estate agent.

Buyer to verify all measurements and facts.

Ownership History

Date Name Owned For Owner Type

Purchase Details

Listed on
Aug 1, 2019
Closed on
Oct 1, 2019
Sold by
Grier Barnard W and Grier Donna Davis
Bought by
Cappola Joseph F and Hooke Richard E
Seller's Agent
Debbie Krantz
WATSON REALTY CORP
Buyer's Agent
NON MLS
NON MLS
List Price
$267,000
Sold Price
$260,000
Premium/Discount to List
-$7,000
-2.62%
Current Estimated Value
$395,894

Home Financials for this Owner

Home Financials are based on the most recent Mortgage that was taken out on this home.
Estimated Appreciation
$135,894
Avg. Annual Appreciation
7.16%
Original Mortgage
$234,000
Outstanding Balance
$204,996
Interest Rate
3.5%
Mortgage Type
New Conventional
Estimated Equity
$190,898
Source: Public Records

Range of Values:

Collateral Analytics

Collateral Analytics Collateral Analytics AVMs (Automated Valuation Model) employ a number of statistical approaches combined with neighborhood-specific comparable selection guarantees the most up-to-date and precise valuations.

Not Available

Collateral Analytics does not have data for the current month. Please view the chart for historical values.

ICE

ICE Mortgage Technology ICE Mortgage Technology’s AVM (Automated Valuation Model) is a state-of-the-art online residential property valuation tool that provides a quick and accurate estimate of the value of almost any home in the U.S.

Not Available

ICE Mortgage Technology does not have data for the current month. Please view the chart for historical values.

First American

First American First American Data & Analytics’ next-generation AVM combines unrivaled data assets with a blended ensemble of valuation models to produce highly accurate, reliable valuations you can trust.

Not Available

First American does not have data for the current month. Please view the chart for historical values.

Quantarium

Quantarium Quantarium’s valuation service, repeatedly proven the industry’s most accurate and comprehensive, is supercharged with a self-learning and auto-tuning AI engine that continually becomes smarter and more accurate as it processes daily inputs from the industry’s leading RE data lake.

Not Available

Quantarium does not have data for the current month. Please view the chart for historical values.

Average Value
Not Available
List Price
Sold Price
Create a Home Valuation Report for This Property
The Home Valuation Report is an in-depth analysis detailing your home's value as well as a comparison with similar homes in the area

Home Values in the Area

Source: Public Records

Average Home Value in this Area


Source: Public Records

Purchase History

Date Buyer Sale Price Title Company
Cappola Joseph F $260,000 Attorney
Source: Public Records

Mortgage History

Date Status Borrower Loan Amount
Open Cappola Joseph F $234,000
Source: Public Records

Property History

Date Event Price List to Sale Price per Sq Ft Prior Sale
12/17/2023 12/17/23 Off Market $260,000 -- --
10/02/2019 10/02/19 Sold $260,000 -2.6% $259 / Sq Ft View Prior Sale
09/25/2019 09/25/19 Pending -- -- --
08/01/2019 08/01/19 For Sale $267,000 -- $266 / Sq Ft

Tax History Compared to Growth

Source: Public Records

Tax History

Year Tax Paid Tax Assessment Tax Assessment Total Assessment is a certain percentage of the fair market value that is determined by local assessors to be the total taxable value of land and additions on the property. Land Improvement
2025 $3,865 $330,097 -- $330,097
2024 $3,865 $356,500 -- $356,500
2023 $3,865 $344,176 $0 $344,176
2022 $3,292 $266,800 $0 $266,800
2021 $2,980 $225,460 $0 $0
2020 $2,890 $216,100 $0 $0
2019 $2,523 $198,900 $0 $0
2018 $2,338 $183,300 $0 $0
2017 $1,974 $136,500 $0 $0
2016 $1,928 $130,260 $0 $0
2015 $1,972 $130,260 $0 $0
2014 $1,959 $127,725 $0 $0
Source: Public Records

Agents Affiliated with this Home

  • Section Image
See All Agents

Map