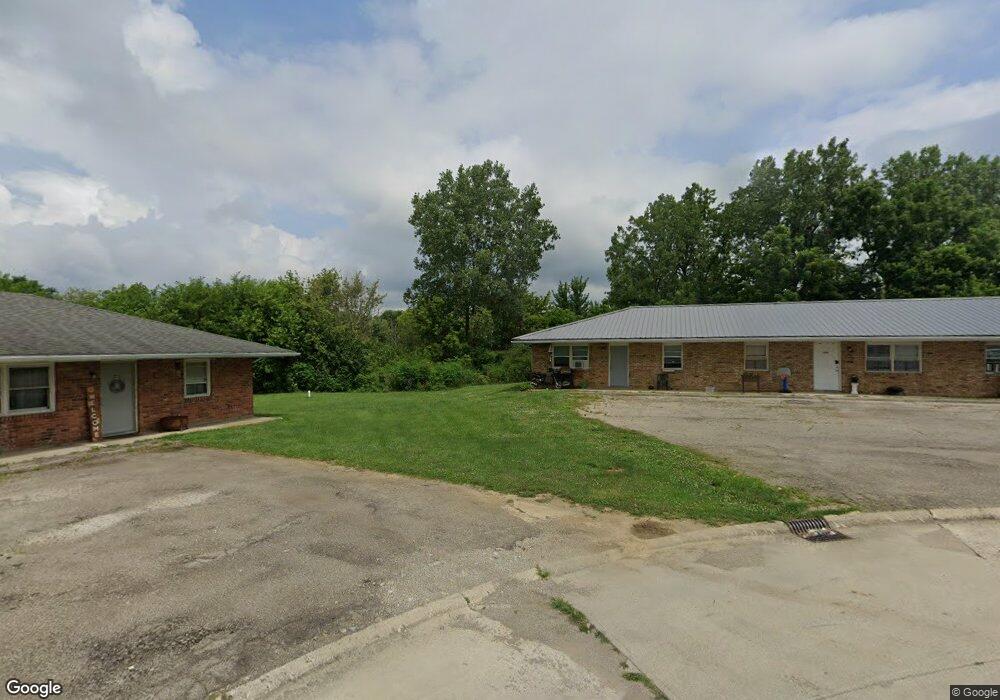
6300 E Piccadilly Rd Muncie, IN 47303
Estimated Value: $142,000 - $174,000
6
Beds
3
Baths
2,523
Sq Ft
$64/Sq Ft
Est. Value
About This Home
This home is located at 6300 E Piccadilly Rd, Muncie, IN 47303 and is currently estimated at $162,667, approximately $64 per square foot. 6300 E Piccadilly Rd is a home located in Delaware County with nearby schools including Selma Elementary School, Selma Middle School, and Wapahani High School.
Ownership History
Date
Name
Owned For
Owner Type
Purchase Details
Closed on
Jun 3, 2019
Sold by
Criswell Paul
Bought by
Golden Sky Capital Llc-S
Current Estimated Value
Purchase Details
Closed on
Feb 24, 2011
Sold by
Fannie Mae
Bought by
Criswell Paul
Purchase Details
Closed on
May 12, 2009
Sold by
Evans Ralph R
Bought by
Federal National Mortgage Association
Purchase Details
Closed on
Jan 19, 2007
Sold by
Bank Of New York Trust Company Na
Bought by
Evans Ralph R
Home Financials for this Owner
Home Financials are based on the most recent Mortgage that was taken out on this home.
Original Mortgage
$55,200
Interest Rate
6.28%
Mortgage Type
New Conventional
Purchase Details
Closed on
Aug 8, 2006
Sold by
Heffernan Nathan and Doe John
Bought by
Jpmorgagn Chase Bank
Create a Home Valuation Report for This Property
The Home Valuation Report is an in-depth analysis detailing your home's value as well as a comparison with similar homes in the area
Purchase History
| Date | Buyer | Sale Price | Title Company |
|---|---|---|---|
| Golden Sky Capital Llc-S | -- | None Available | |
| Criswell Paul | -- | Statewide Title Company Inc | |
| Federal National Mortgage Association | $86,599 | None Available | |
| Evans Ralph R | -- | None Available | |
| Jpmorgagn Chase Bank | $59,118 | None Available |
Source: Public Records
Mortgage History
| Date | Status | Borrower | Loan Amount |
|---|---|---|---|
| Previous Owner | Evans Ralph R | $55,200 |
Source: Public Records
Tax History
| Year | Tax Paid | Tax Assessment Tax Assessment Total Assessment is a certain percentage of the fair market value that is determined by local assessors to be the total taxable value of land and additions on the property. | Land | Improvement |
|---|---|---|---|---|
| 2025 | $1,051 | $78,600 | $14,100 | $64,500 |
| 2024 | $1,051 | $65,100 | $14,100 | $51,000 |
| 2023 | $1,061 | $65,100 | $14,100 | $51,000 |
| 2022 | $1,102 | $65,700 | $14,100 | $51,600 |
| 2021 | $1,276 | $69,500 | $17,000 | $52,500 |
| 2020 | $1,638 | $82,600 | $17,000 | $65,600 |
| 2019 | $1,624 | $85,300 | $17,000 | $68,300 |
| 2018 | $1,565 | $85,300 | $17,000 | $68,300 |
| 2017 | $1,488 | $81,000 | $17,900 | $63,100 |
| 2016 | $1,557 | $87,300 | $17,900 | $69,400 |
| 2014 | $1,577 | $85,000 | $17,900 | $67,100 |
| 2013 | -- | $84,300 | $17,900 | $66,400 |
Source: Public Records
Map
Nearby Homes
- 5909 E Robert St
- 401 N Gray St
- 700 N Cook Rd
- 4838 E Jackson St
- 1409 N Truitt Rd
- 4708 E Heritage Cir
- 4705 E Heritage Cir
- 411 N State St
- 3508 E Wysor St
- 2300 N Country Club Rd
- 616 N Edgewood Dr
- 4308 E Maple Manor Pkwy
- 701 N Claypool Rd
- 2510 S Whitney Rd
- 103 S Delawanda Ave
- 1905 N Garnet Ave
- 1523 S Burlington Dr
- 1711 S Burlington Dr
- 300 N Biltmore Ave
- 305 N Biltmore Ave
- 6302 E Piccadilly Rd
- 6306 E Piccadilly Rd
- 6314 Picadilly
- 6314 E Piccadilly Rd
- 6314 E Piccadilly Rd
- 6318 E Piccadilly Rd
- 6311 E Piccadilly Rd
- 6309 E Piccadilly Rd
- 6301 E Picadilly
- 6307 E Piccadilly Rd
- 6313 E Piccadilly Rd
- 6321 E Piccadilly Rd
- 6400 E Piccadilly Rd
- 108 S Keystone Cir
- 6445 E Jackson St
- 6319 E Piccadilly Rd
- 200 S Keystone Cir
- 112 S Keystone Cir
- 110 S Keystone Cir
- 6406 E Piccadilly Rd
Your Personal Tour Guide
Ask me questions while you tour the home.