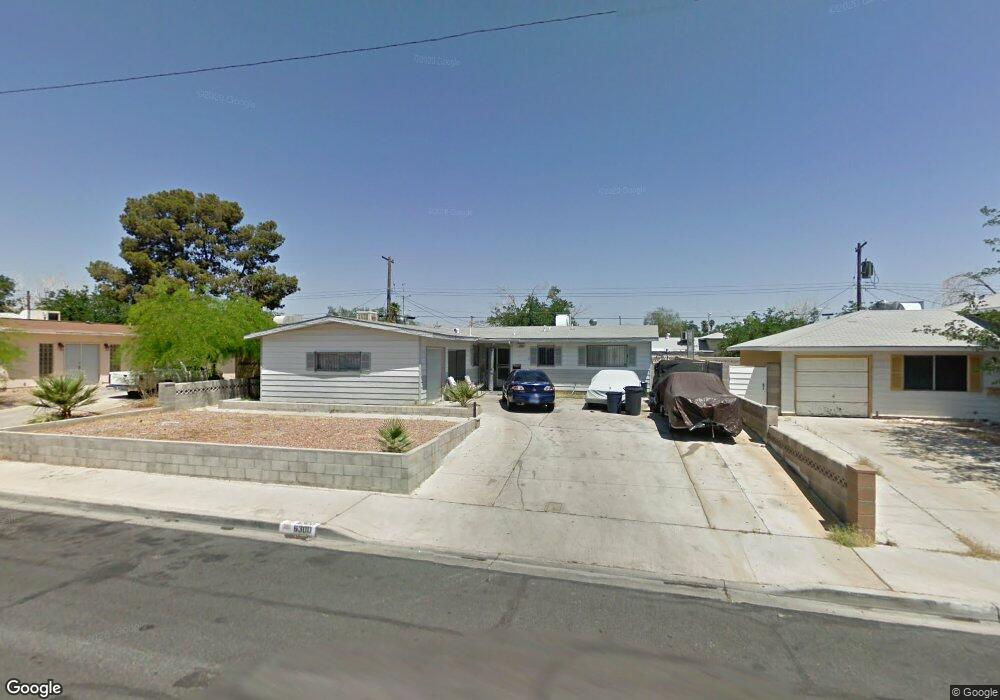
6300 Parsifal Place Las Vegas, NV 89107
Pittman NeighborhoodEstimated Value: $358,975 - $392,000
3
Beds
2
Baths
1,560
Sq Ft
$242/Sq Ft
Est. Value
About This Home
This home is located at 6300 Parsifal Place, Las Vegas, NV 89107 and is currently estimated at $378,244, approximately $242 per square foot. 6300 Parsifal Place is a home located in Clark County with nearby schools including Vail Pittman Elementary School, Frank F Garside Junior High School, and Western High School.
Ownership History
Date
Name
Owned For
Owner Type
Purchase Details
Closed on
Aug 6, 2024
Sold by
Vaca-Torres Angelica and Vaca Angelica
Bought by
Vaca Juan Manuel
Current Estimated Value
Purchase Details
Closed on
Dec 2, 2002
Sold by
Elmer Barbara Black
Bought by
Vaca Juan Manuel
Home Financials for this Owner
Home Financials are based on the most recent Mortgage that was taken out on this home.
Original Mortgage
$132,914
Interest Rate
6.28%
Purchase Details
Closed on
Aug 13, 2002
Sold by
Bruner Richard Alan
Bought by
Elmer Barbara Black and Barbara Black Elmer Living Trust
Purchase Details
Closed on
Oct 2, 2001
Sold by
Elmer Barbara Black
Bought by
Bruner Richard Alan
Home Financials for this Owner
Home Financials are based on the most recent Mortgage that was taken out on this home.
Original Mortgage
$73,000
Interest Rate
6.9%
Mortgage Type
Seller Take Back
Create a Home Valuation Report for This Property
The Home Valuation Report is an in-depth analysis detailing your home's value as well as a comparison with similar homes in the area
Home Values in the Area
Average Home Value in this Area
Purchase History
| Date | Buyer | Sale Price | Title Company |
|---|---|---|---|
| Vaca Juan Manuel | -- | None Listed On Document | |
| Torres Jessica Guadalupe Va | -- | None Listed On Document | |
| Vaca Juan Manuel | $135,000 | Lawyers Title | |
| Elmer Barbara Black | -- | -- | |
| Bruner Richard Alan | -- | -- |
Source: Public Records
Mortgage History
| Date | Status | Borrower | Loan Amount |
|---|---|---|---|
| Previous Owner | Vaca Juan Manuel | $132,914 | |
| Previous Owner | Bruner Richard Alan | $73,000 |
Source: Public Records
Tax History Compared to Growth
Tax History
| Year | Tax Paid | Tax Assessment Tax Assessment Total Assessment is a certain percentage of the fair market value that is determined by local assessors to be the total taxable value of land and additions on the property. | Land | Improvement |
|---|---|---|---|---|
| 2025 | $994 | $50,183 | $29,750 | $20,433 |
| 2024 | $921 | $50,183 | $29,750 | $20,433 |
| 2023 | $921 | $49,600 | $31,150 | $18,450 |
| 2022 | $853 | $42,751 | $26,250 | $16,501 |
| 2021 | $790 | $39,178 | $23,800 | $15,378 |
| 2020 | $731 | $36,309 | $21,350 | $14,959 |
| 2019 | $685 | $32,263 | $17,850 | $14,413 |
| 2018 | $654 | $28,538 | $15,050 | $13,488 |
| 2017 | $931 | $28,408 | $15,050 | $13,358 |
| 2016 | $613 | $24,107 | $11,200 | $12,907 |
| 2015 | $611 | $21,620 | $9,100 | $12,520 |
| 2014 | $593 | $17,549 | $5,250 | $12,299 |
Source: Public Records
Map
Nearby Homes
- 6261 Rassler Ave
- 6244 Rassler Ave
- 6121 Fawn Cir
- 6224 Fargo Ave
- 6112 Denver Cir
- 704 N Wallace Dr
- 6299 W Washington Ave
- 304 N Torrey Pines Dr
- 6100 Fawn Cir
- 6325 W Washington Ave
- 100 S Crestline Dr Unit 17
- 5924 Iris Ave
- 6505 Hill View Ave
- 6229 Saginaw Dr
- 6509 Brushwood Ln
- 6233 Elton Ave
- 6521 Aberdeen Ln
- 6205 Carmen Blvd
- 6521 Sugarpine Ln
- 812 Pepperwood Ln
- 6256 Parsifal Place
- 6304 Parsifal Place
- 6301 Hobart Ave
- 6252 Parsifal Place
- 6308 Parsifal Place
- 6305 Hobart Ave
- 6253 Hobart Ave
- 6301 Parsifal Place
- 6305 Parsifal Place
- 6309 Hobart Ave
- 6253 Parsifal Place
- 6312 Parsifal Place
- 6248 Parsifal Place
- 6249 Hobart Ave
- 6309 Parsifal Place
- 6249 Parsifal Place
- 6313 Hobart Ave
- 6313 Parsifal Place
- 6245 Hobart Ave
- 6316 Parsifal Place