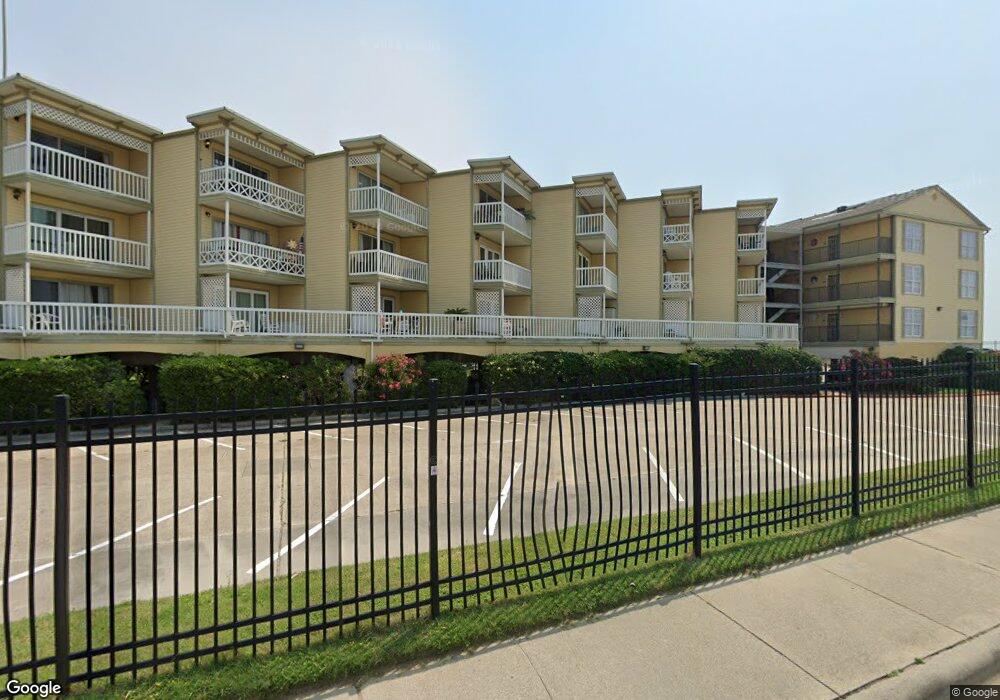
6300 Seawall Blvd Unit 9223 Galveston, TX 77551
Central City NeighborhoodEstimated Value: $140,000 - $189,000
1
Bed
1
Bath
474
Sq Ft
$357/Sq Ft
Est. Value
About This Home
This home is located at 6300 Seawall Blvd Unit 9223, Galveston, TX 77551 and is currently estimated at $169,434, approximately $357 per square foot. 6300 Seawall Blvd Unit 9223 is a home located in Galveston County with nearby schools including Burnet STREAM Magnet School, Parker Elementary School, and Oppe Elementary School.
Ownership History
Date
Name
Owned For
Owner Type
Purchase Details
Closed on
Jun 19, 2022
Sold by
Douglas Dennis and Douglas Hope P
Bought by
Stearns Scott
Current Estimated Value
Home Financials for this Owner
Home Financials are based on the most recent Mortgage that was taken out on this home.
Original Mortgage
$138,750
Outstanding Balance
$131,975
Interest Rate
5.23%
Mortgage Type
New Conventional
Estimated Equity
$37,459
Purchase Details
Closed on
Jun 12, 2012
Sold by
Cochran Winston E
Bought by
Hope Douglas Dennis and Hope Douglas P
Purchase Details
Closed on
Jan 8, 2010
Sold by
Cates Christopher and Cates Tyanna
Bought by
Cochran Winston E
Purchase Details
Closed on
Apr 28, 2005
Sold by
Leon Leonard and Leon Dora Rose
Bought by
Cates Chris
Create a Home Valuation Report for This Property
The Home Valuation Report is an in-depth analysis detailing your home's value as well as a comparison with similar homes in the area
Home Values in the Area
Average Home Value in this Area
Purchase History
| Date | Buyer | Sale Price | Title Company |
|---|---|---|---|
| Stearns Scott | -- | South Land Title Company | |
| Hope Douglas Dennis | -- | Southland Title Llc | |
| Cochran Winston E | $21,000 | None Available | |
| Cates Chris | -- | Southland Title Company |
Source: Public Records
Mortgage History
| Date | Status | Borrower | Loan Amount |
|---|---|---|---|
| Open | Stearns Scott | $138,750 |
Source: Public Records
Tax History Compared to Growth
Tax History
| Year | Tax Paid | Tax Assessment Tax Assessment Total Assessment is a certain percentage of the fair market value that is determined by local assessors to be the total taxable value of land and additions on the property. | Land | Improvement |
|---|---|---|---|---|
| 2025 | $3,541 | $157,620 | $9,420 | $148,200 |
| 2024 | $3,541 | $204,600 | $9,420 | $195,180 |
| 2023 | $3,541 | $206,060 | $9,420 | $196,640 |
| 2022 | $3,471 | $172,170 | $9,420 | $162,750 |
| 2021 | $3,139 | $138,760 | $9,420 | $129,340 |
| 2020 | $2,820 | $117,680 | $9,420 | $108,260 |
| 2019 | $2,368 | $96,030 | $9,420 | $86,610 |
| 2018 | $1,869 | $75,530 | $9,420 | $66,110 |
| 2017 | $1,847 | $75,530 | $9,420 | $66,110 |
| 2016 | $1,402 | $57,330 | $9,420 | $47,910 |
| 2015 | $1,519 | $61,380 | $9,420 | $51,960 |
| 2014 | $1,344 | $44,230 | $9,420 | $34,810 |
Source: Public Records
Map
Nearby Homes
- 6300 Seawall Blvd Unit 2303
- 6300 Seawall Blvd Unit 2104
- 6300 Seawall Blvd Unit 3107
- 6300 Seawall Blvd Unit 9311
- 6300 Seawall Blvd Unit 3326
- 6300 Seawall Blvd Unit 3108
- 6300 Seawall Blvd Unit 3202
- 6300 Seawall Blvd Unit 3215
- 6300 Seawall Blvd Unit 4203
- 6300 Seawall Blvd Unit 6206
- 6300 Seawall Blvd Unit 9205
- 6300 Seawall Blvd Unit 9327
- 6300 Seawall Blvd Unit 9307
- 6300 Seawall Blvd Unit 8204
- 6300 Seawall Blvd Unit 3212
- 6300 Seawall Blvd Unit 8303
- 6300 Seawall Blvd Unit 9109
- 6300 Seawall Blvd Unit 3111
- 6300 Seawall Blvd Unit 1201
- 6300 Seawall Blvd Unit 9207
- 6300 Seawall Blvd Unit 3303
- 6300 Seawall Blvd Unit 9321
- 6300 Seawall Blvd Unit 3113
- 6300 Seawall Blvd Unit 6208
- 6300 Seawall Blvd Unit 3128
- 6300 Seawall Blvd Unit 6105
- 6300 Seawall Blvd Unit 3228
- 6300 Seawall Blvd Unit 7107
- 6300 Seawall Blvd Unit 3302
- 6300 Seawall Blvd Unit 9123
- 6300 Seawall Blvd Unit 3116
- 6300 Seawall Blvd Unit 3104
- 6300 Seawall Blvd Unit 4104
- 6300 Seawall Blvd Unit 3118
- 6300 Seawall Blvd
- 6300 Seawall Blvd Unit 3330
- 6300 Seawall Blvd Unit 3320
- 6300 Seawall Blvd Unit 3225
- 6300 Seawall Blvd Unit 9115
- 6300 Seawall Blvd Unit 2301